Oracle APEX - The Power of Interactive Reports
This post intends to be an in-depth tutorial on Oracle APEX's Interactive Reports and their different options. This is the second in a series of posts about APEX
The views expressed here are my own and do not necessarily reflect the views of Oracle
This post was updated to work with Oracle Application Express 19.1 on October 2nd, 2019
Take a look at other posts in this series:
TL;DR
You can download the finished application from orders_app.apex.sql. It includes the data in the Orders.csv file.
Step by Step Tutorial
APEX was designed with Database Applications in mind. Nowadays many people perform their day to day management with a spreadsheet software, it might seem simpler than getting a database set up for the task, but it really isn't. What if you had to share your excel file with your other store locations? Would you share it via e-mail? How would your changes be synced?
With APEX you have the power to change that with just a few clicks. Just upload your data as it is and it will generate an application with a report and a form for you. You'll be able to keep adding data while making your app available to other people so they can do the same.
The following steps will provide guidance on how to build an APEX Application from an orders spreadsheet and how to make APEX's Interactive Reports work for you.
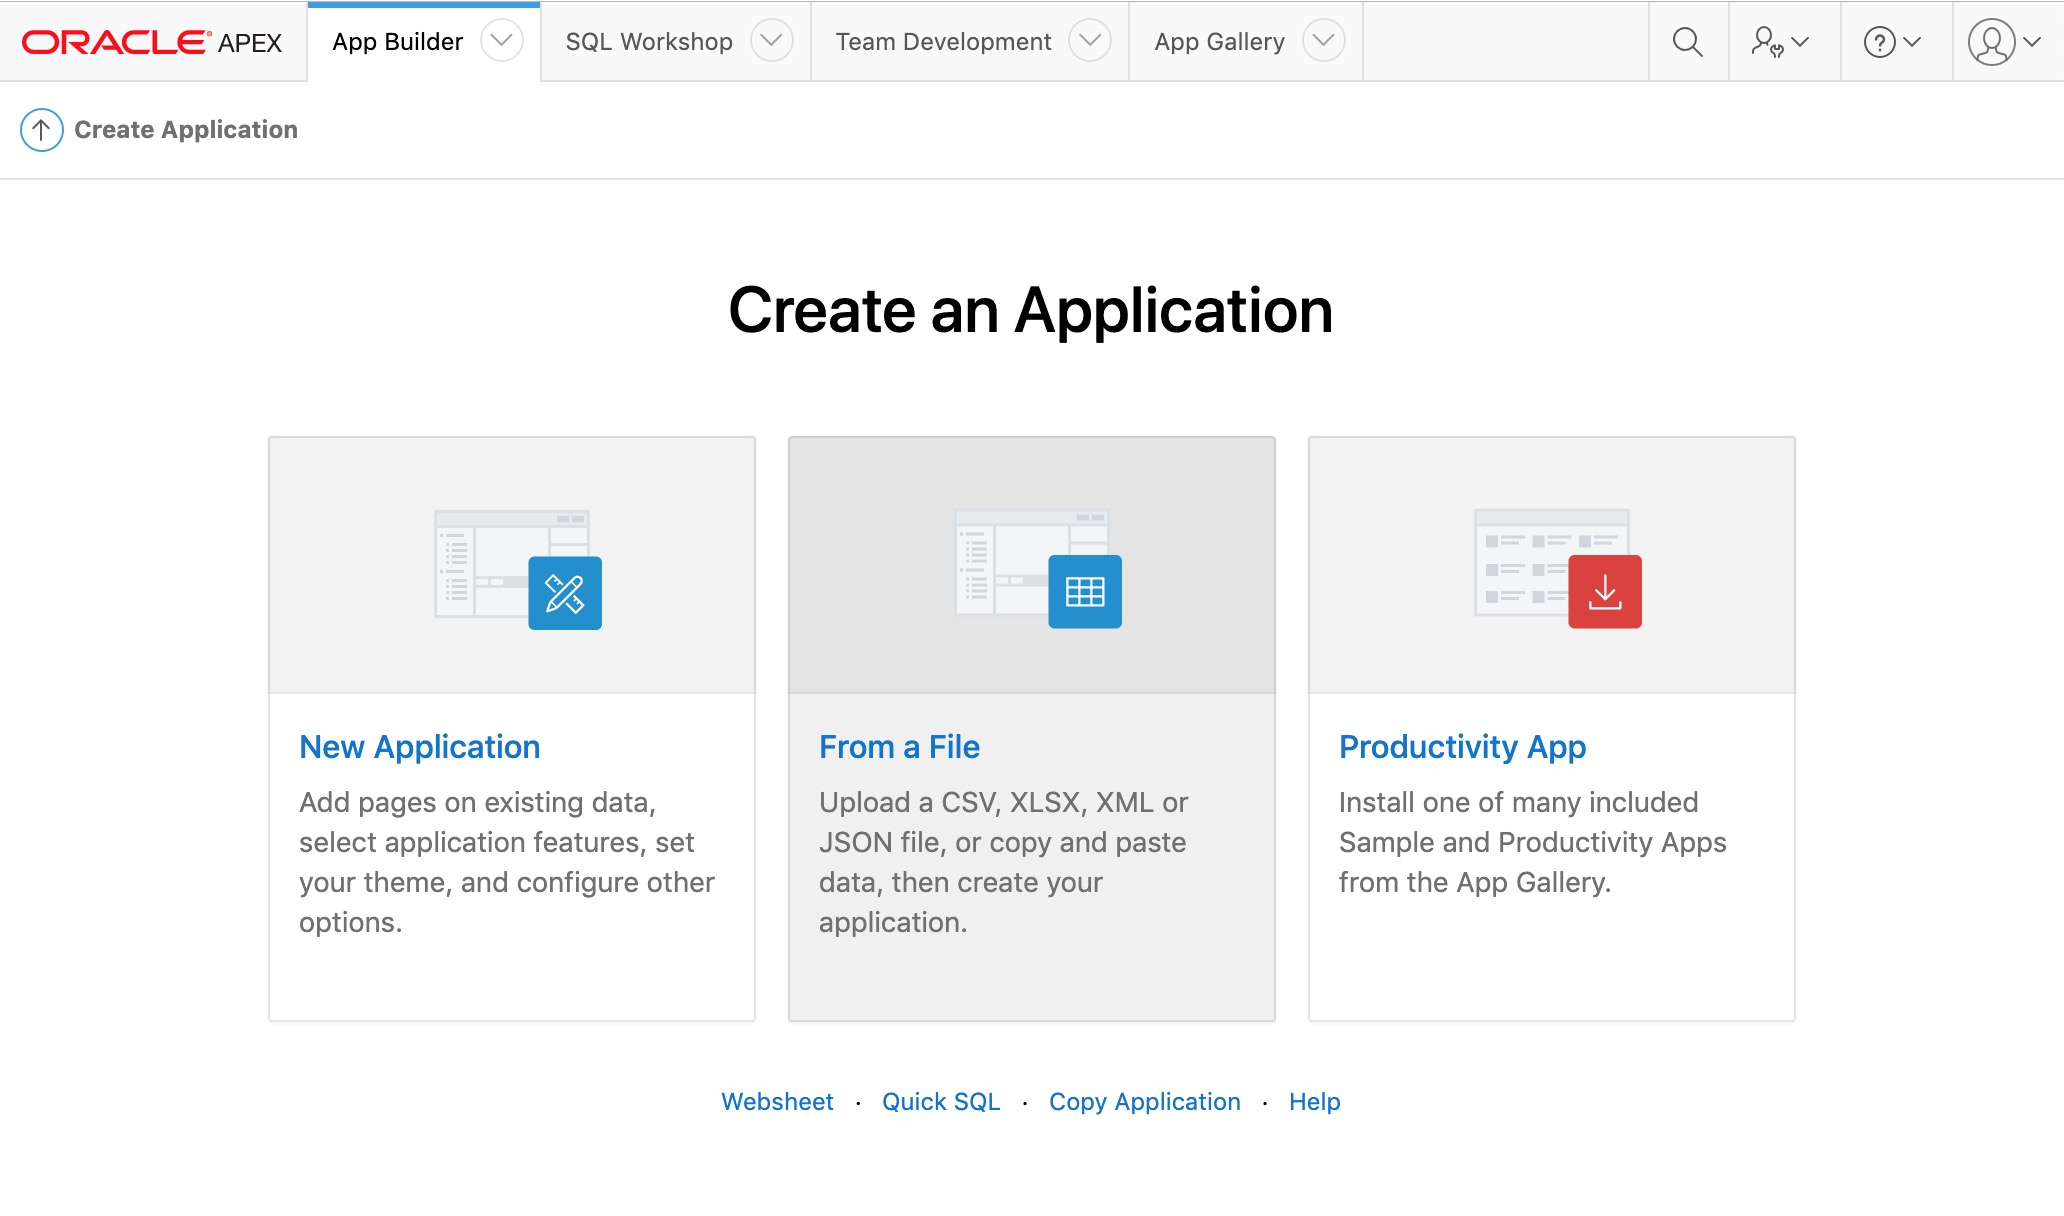
Creating an Application from a Spreadsheet
Once you have an APEX workspace set up and have accessed it. A screen like the one shown below should appear. Click on the Create button.

This will take you to the "Create an Application" page, where you can choose from a range of options to start creating your application. Click on "From a File".
You will be presented with a dialog with two tabs. Make sure the "Upload a file" tab is active.
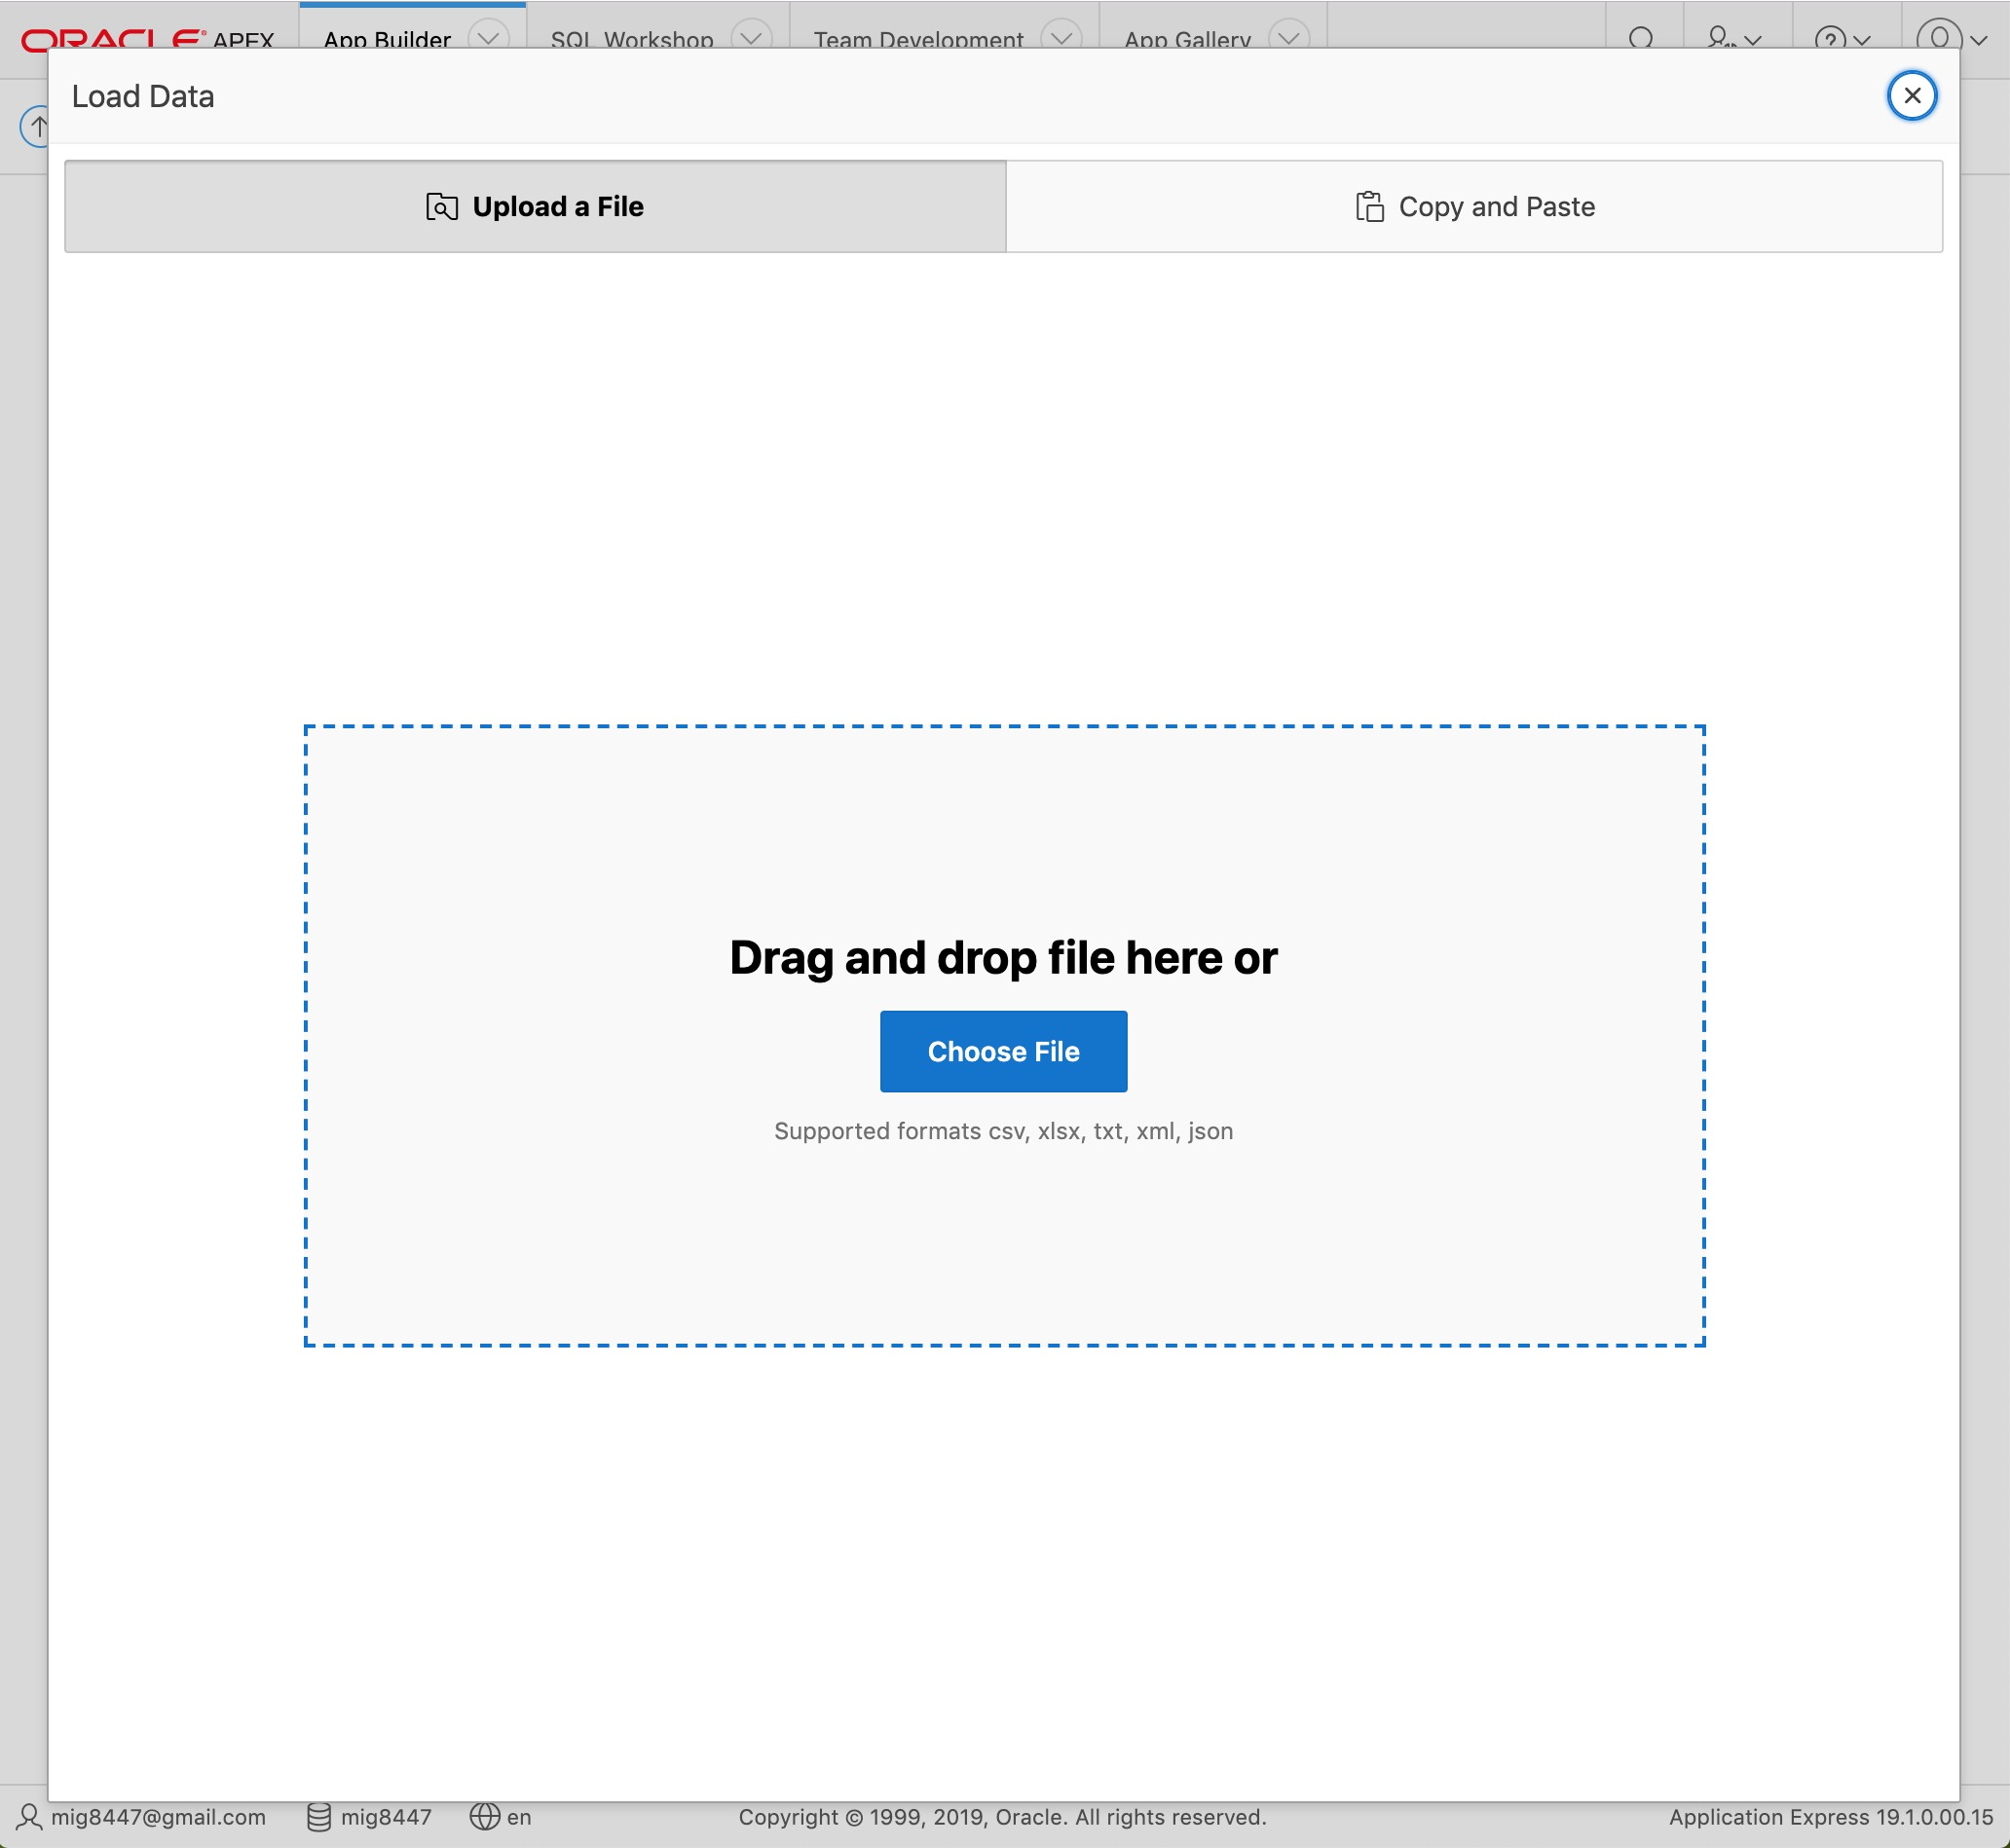
Uploading the Spreadsheet
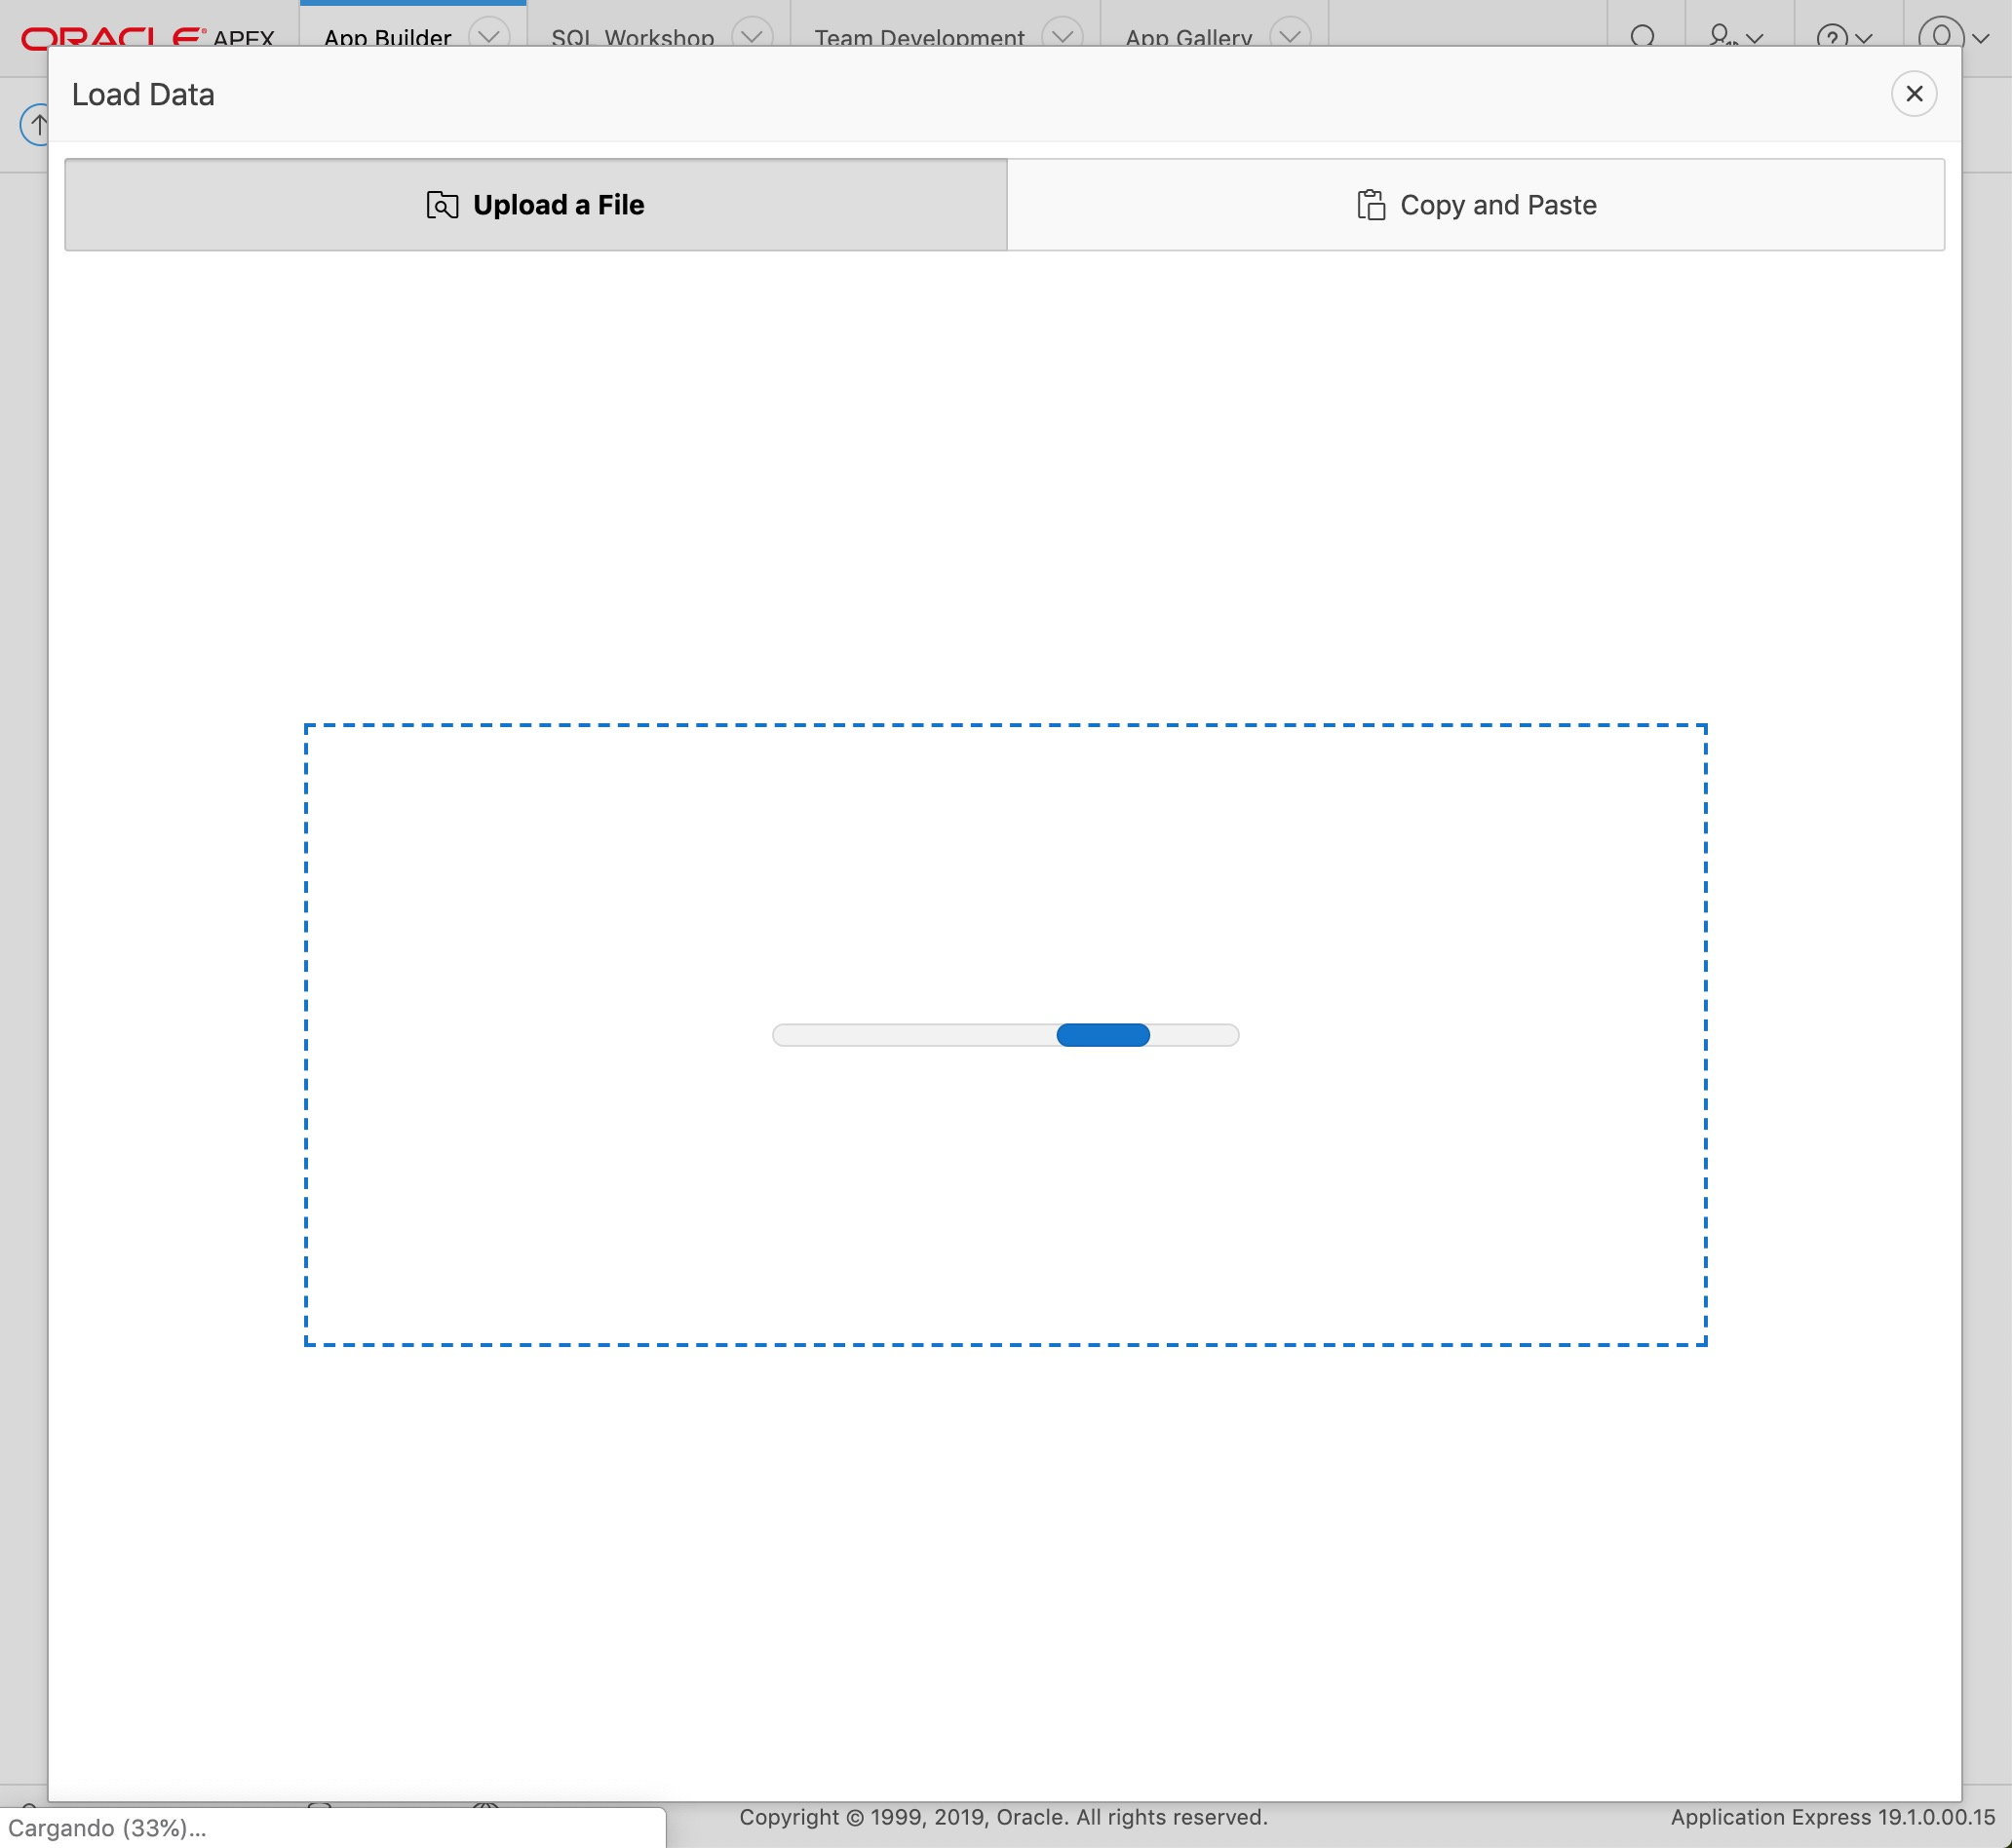
Download the Orders.csv file. Drag and drop the recently downloaded file to the dialog and wait for the file to be uploaded.
After a few seconds the below screen will appear. Write "ORDERS" in the "Table Name" field and continue by clicking the "Load Data" button at the bottom of the page.

After the file is loaded the following screen will be shown.
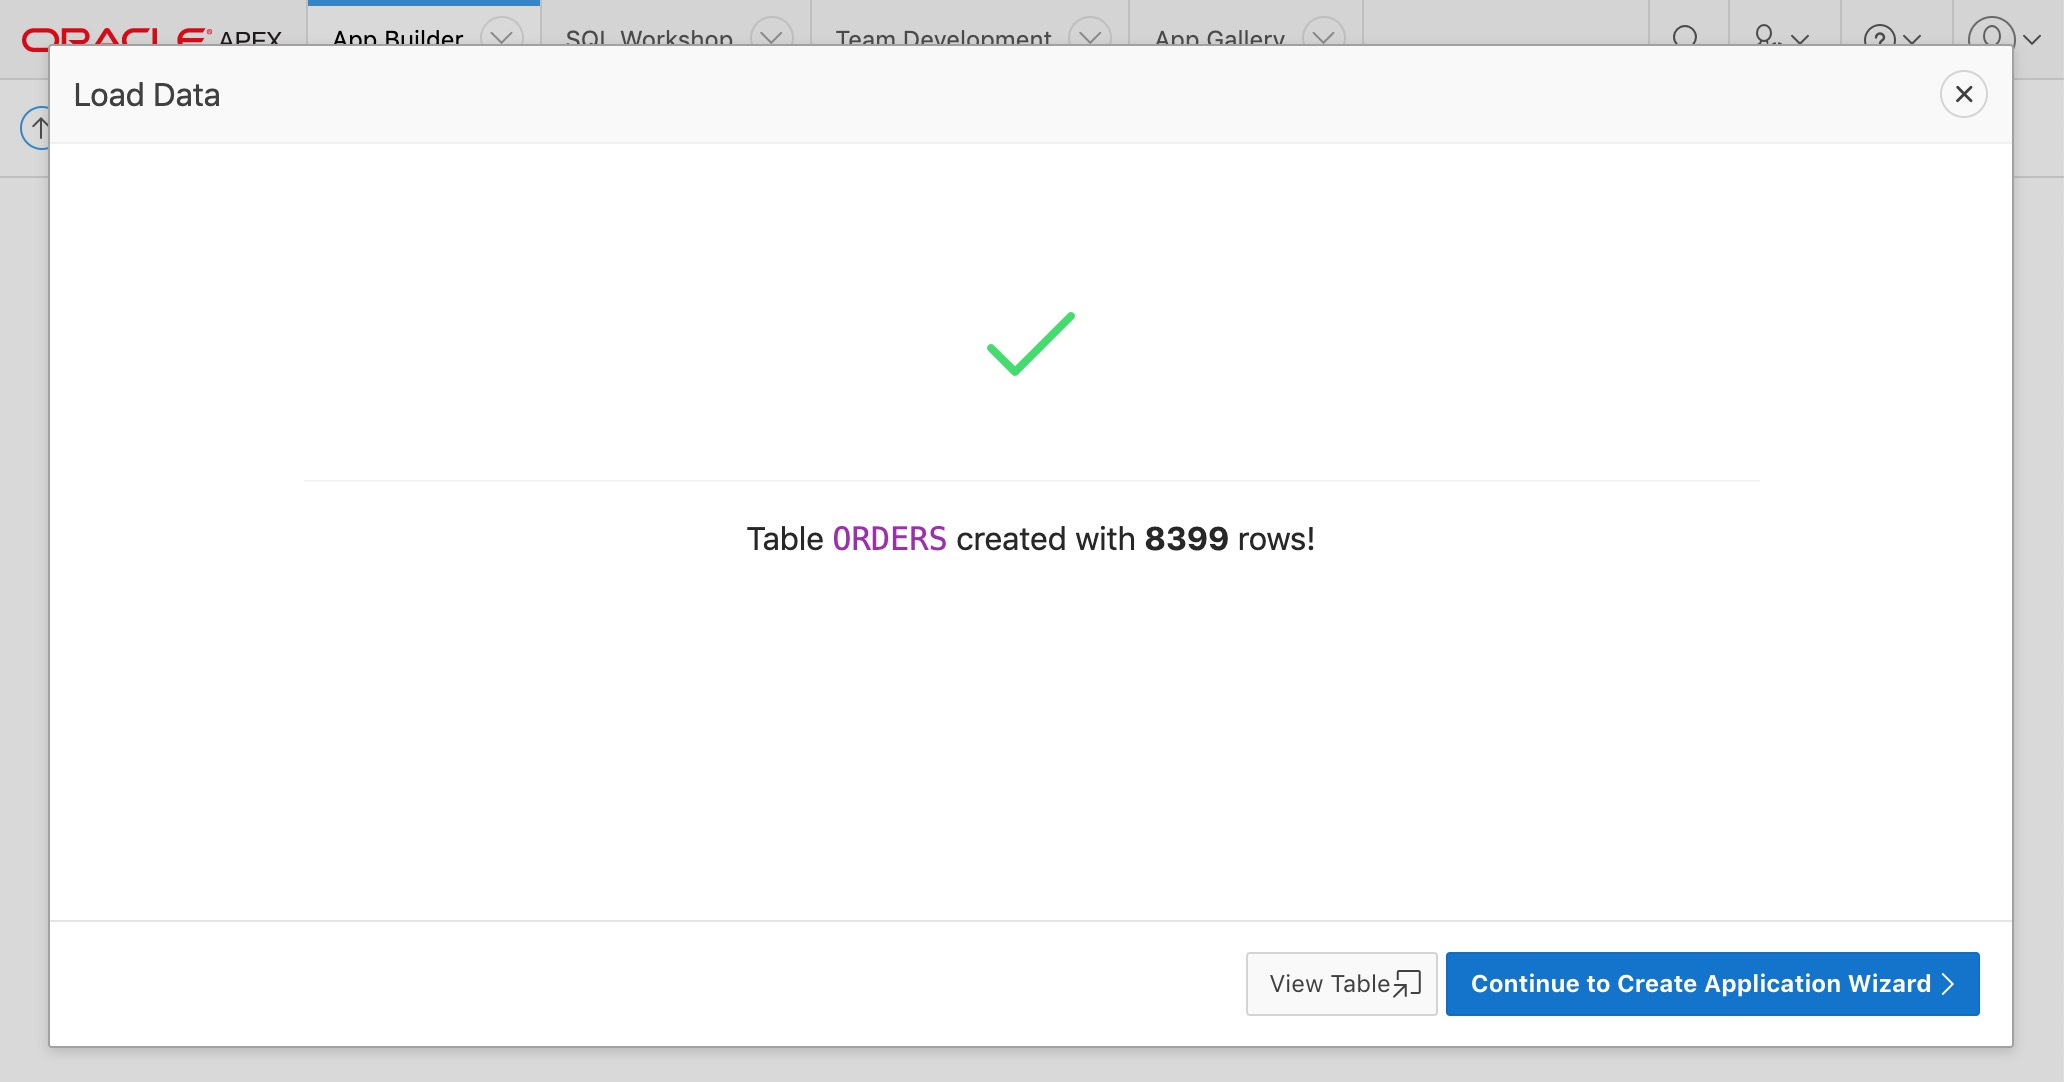
Click on the "Continue to Create Application Wizard" button.
Configuring the Application
Enter "ORDERS" into the "Name" field and click the "Create Application" button at the bottom of the page.
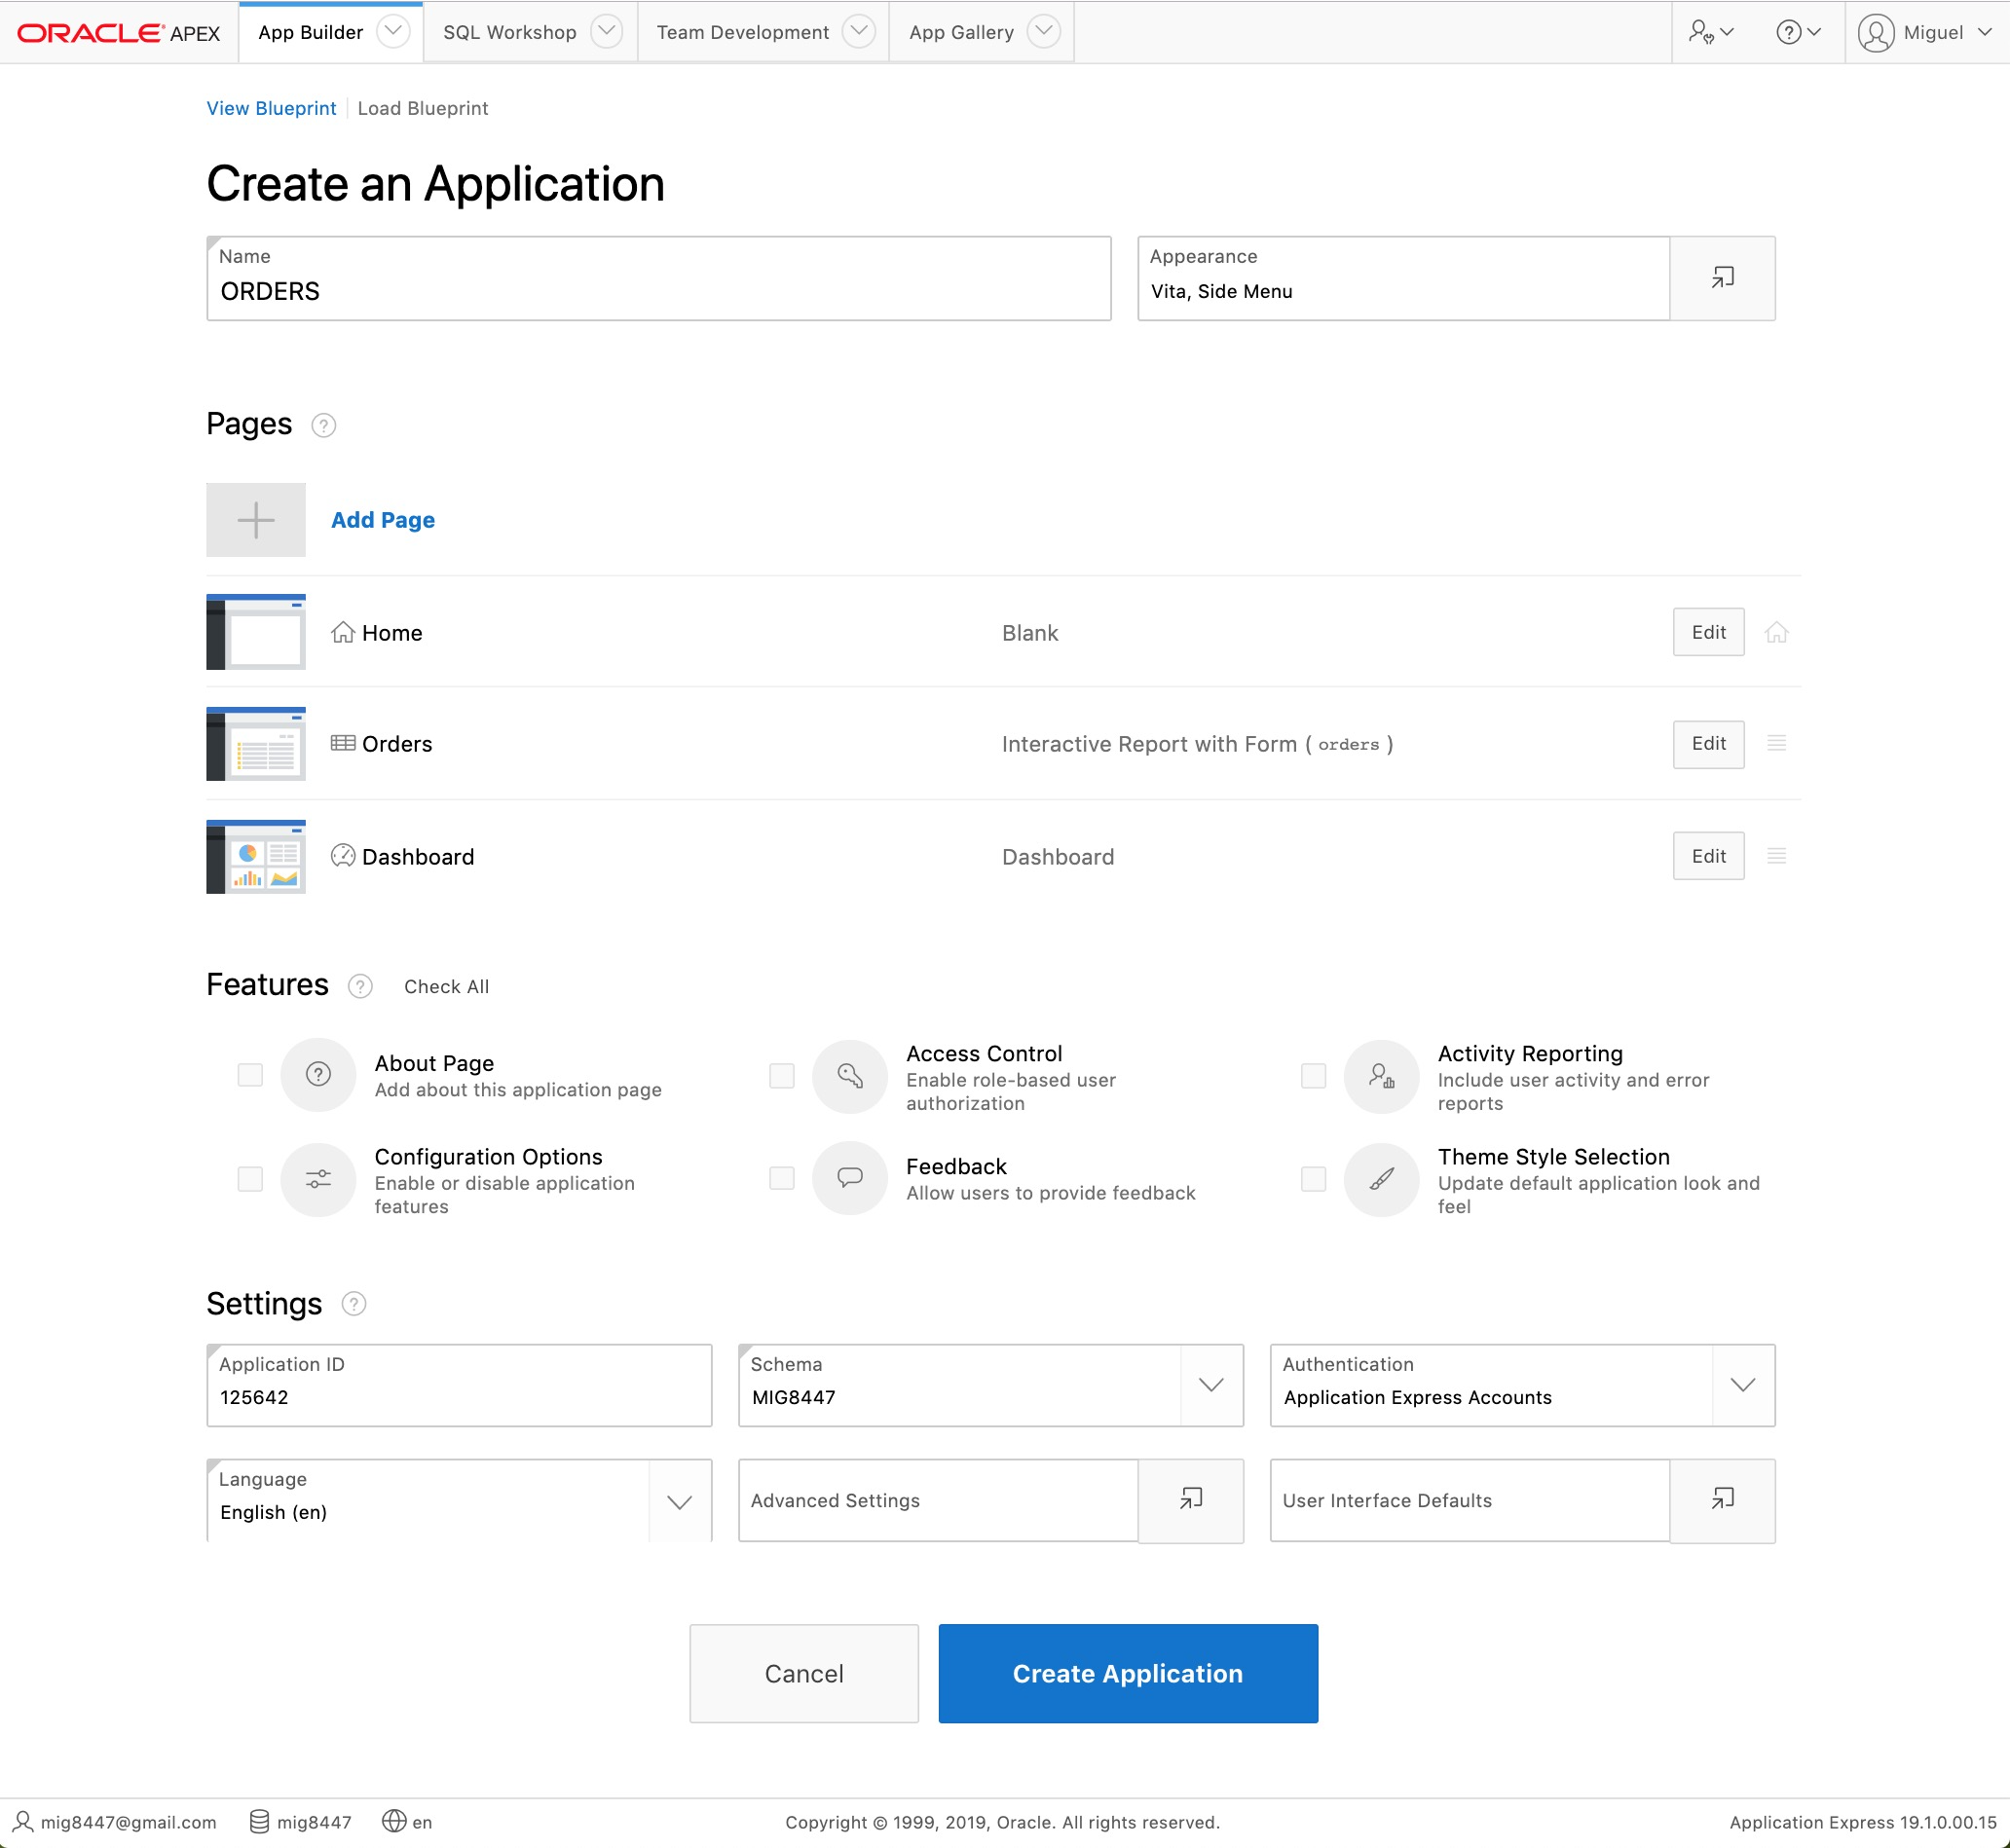
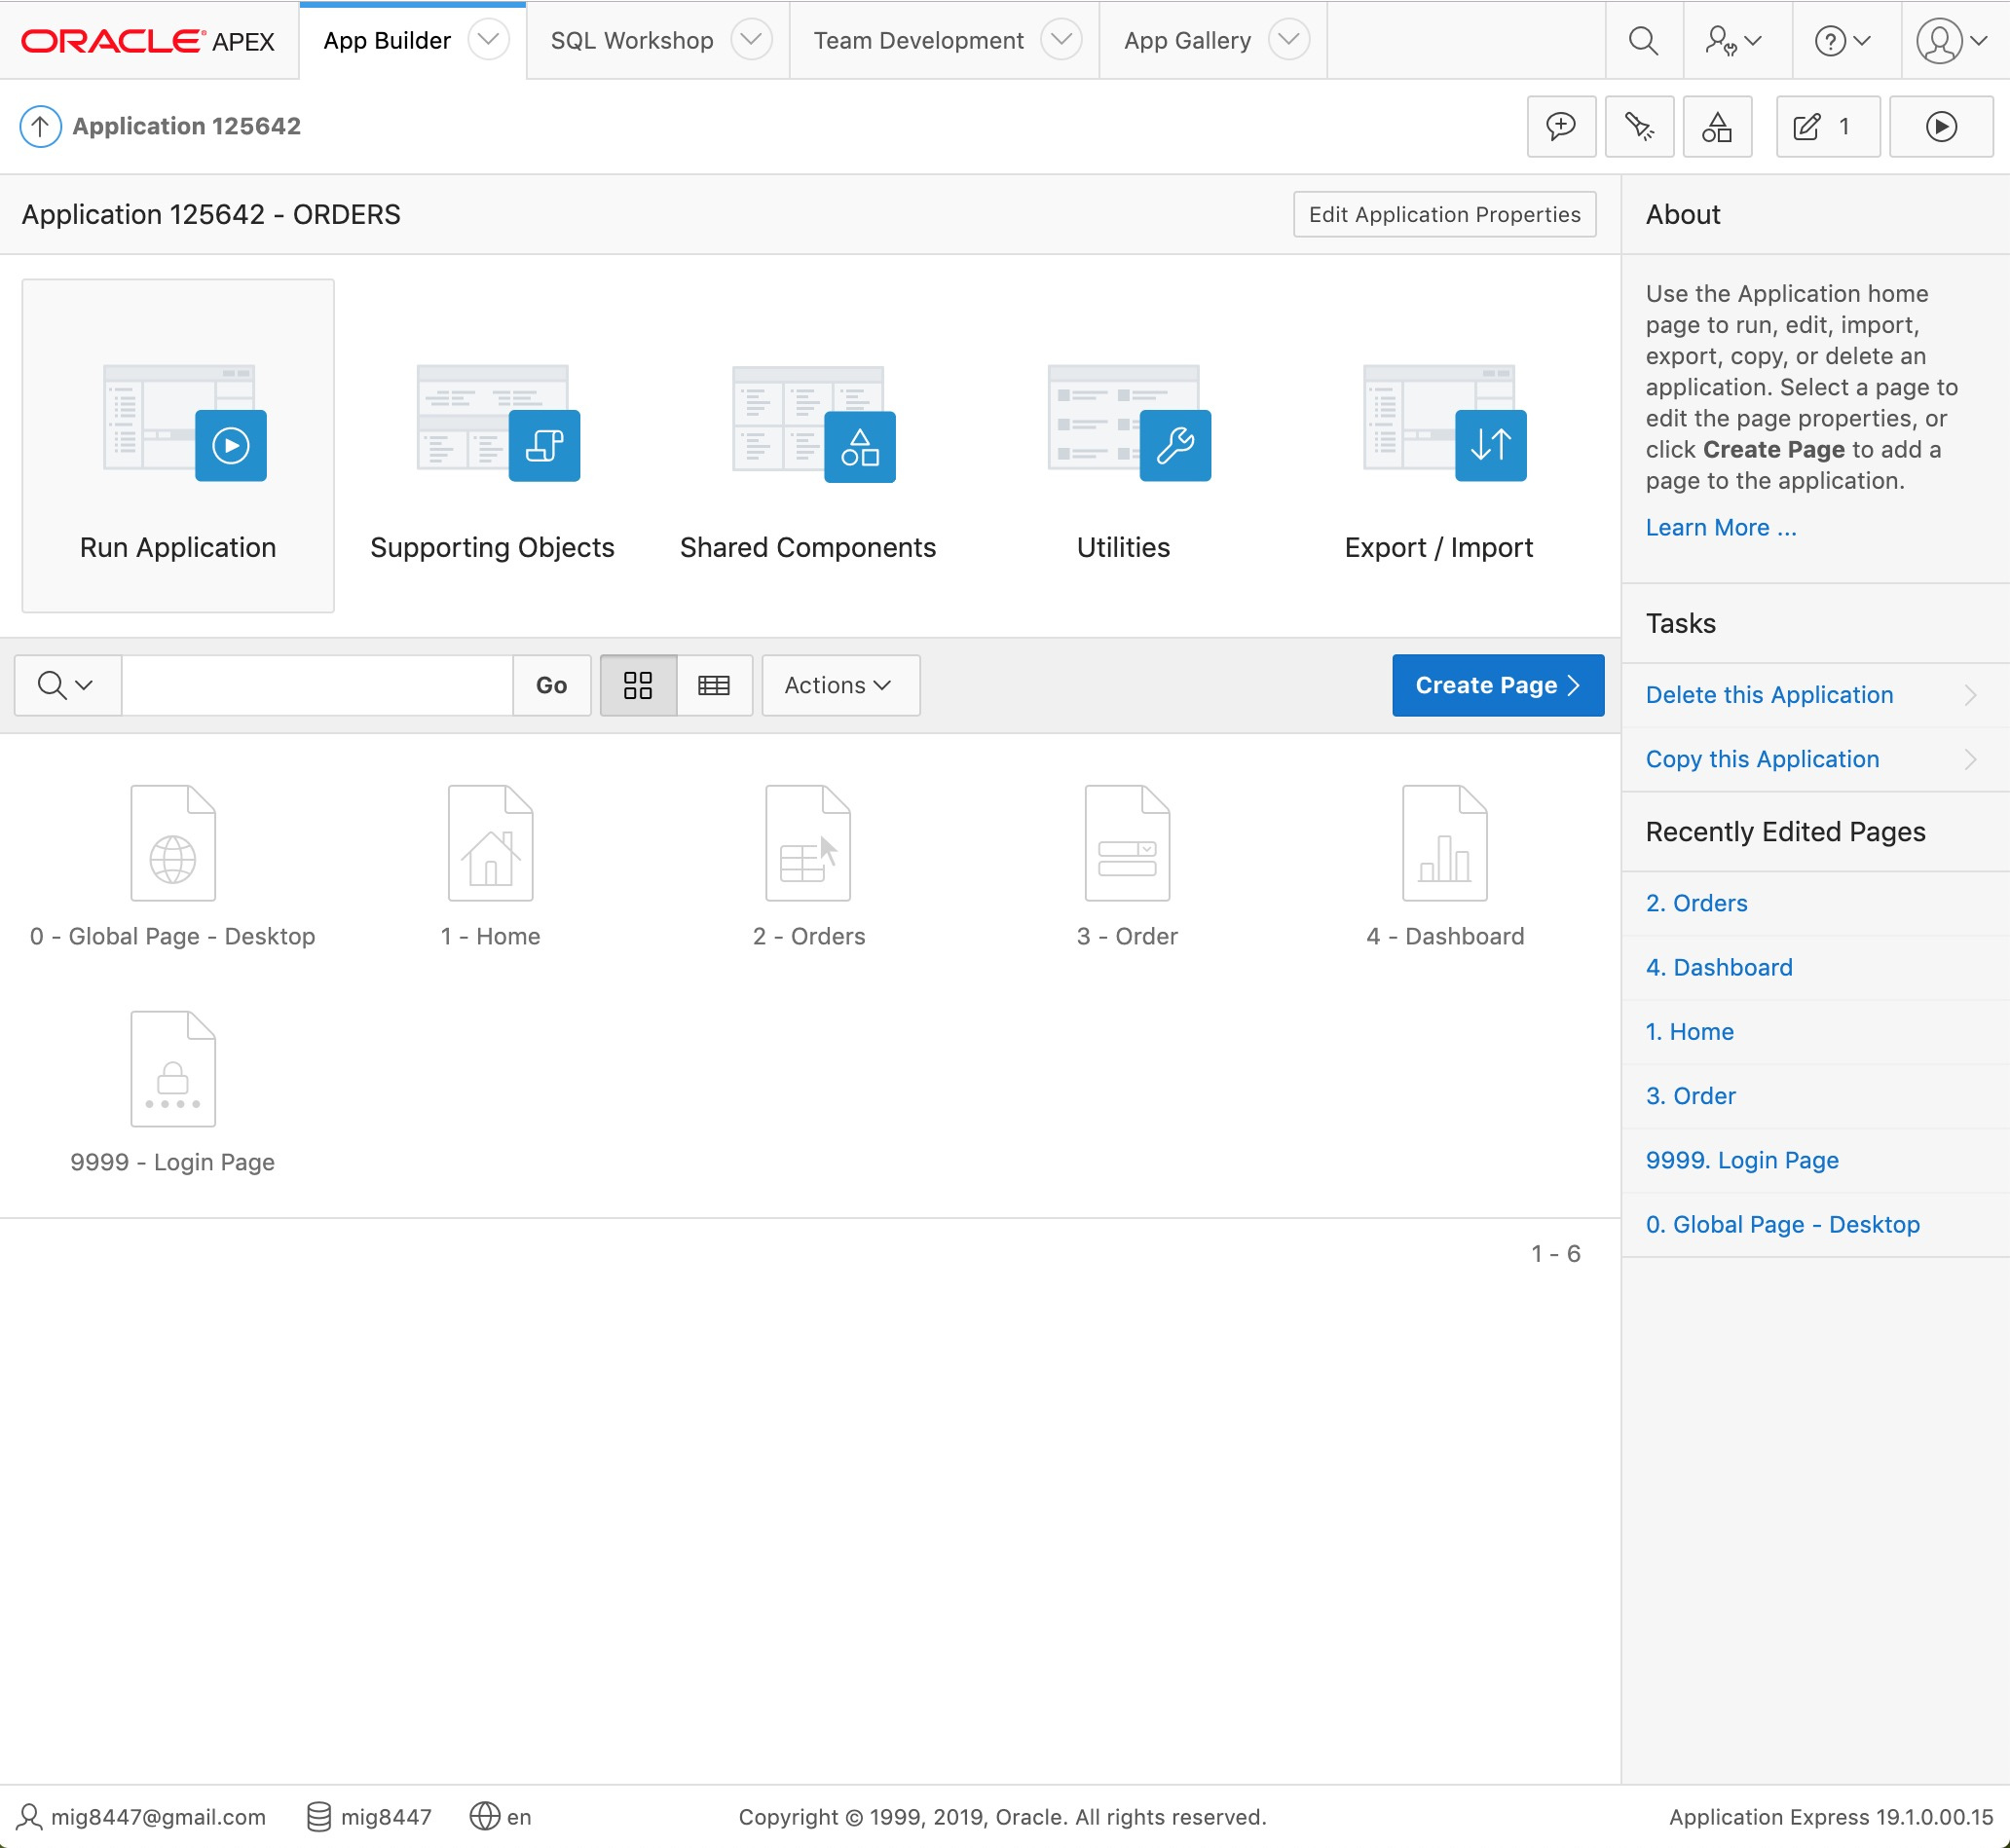
The "Application Builder" is displayed with our application, for which six pages have been created.
Running the Application
Click on the "Run Application" icon at the top of the page. The application user login will appear.
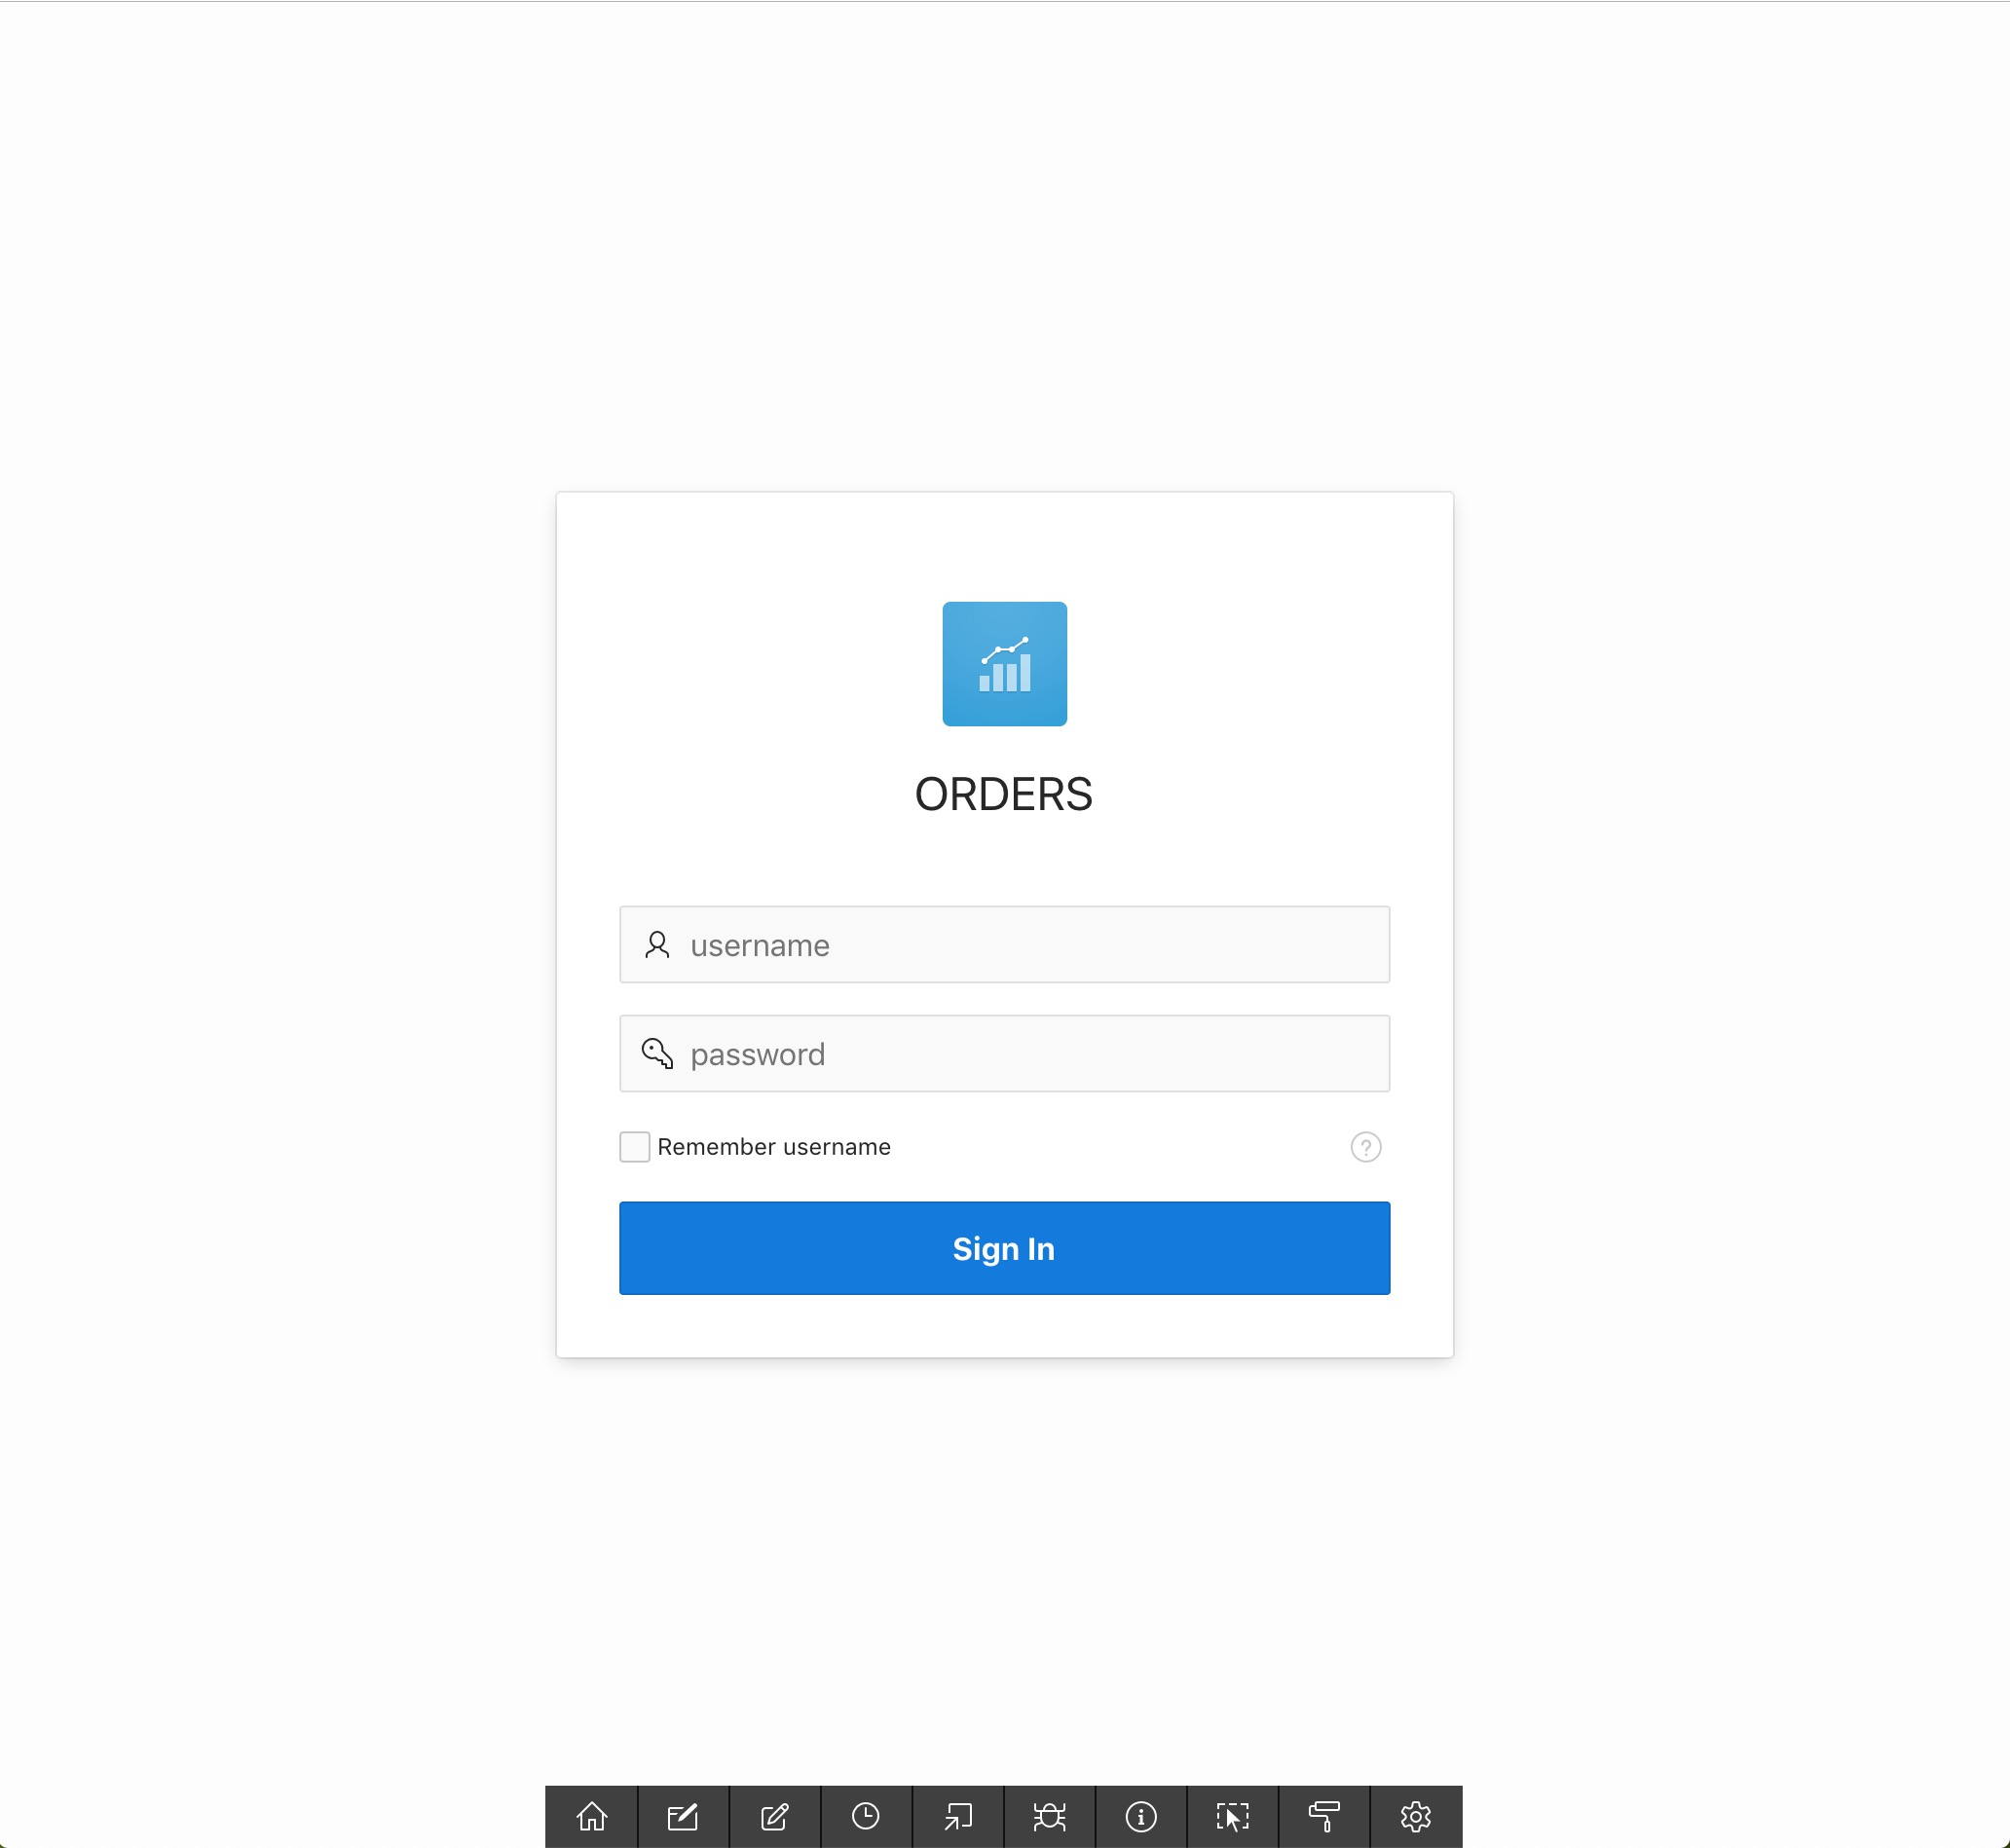
Enter your workspace login details and click on the "Sign In" button.
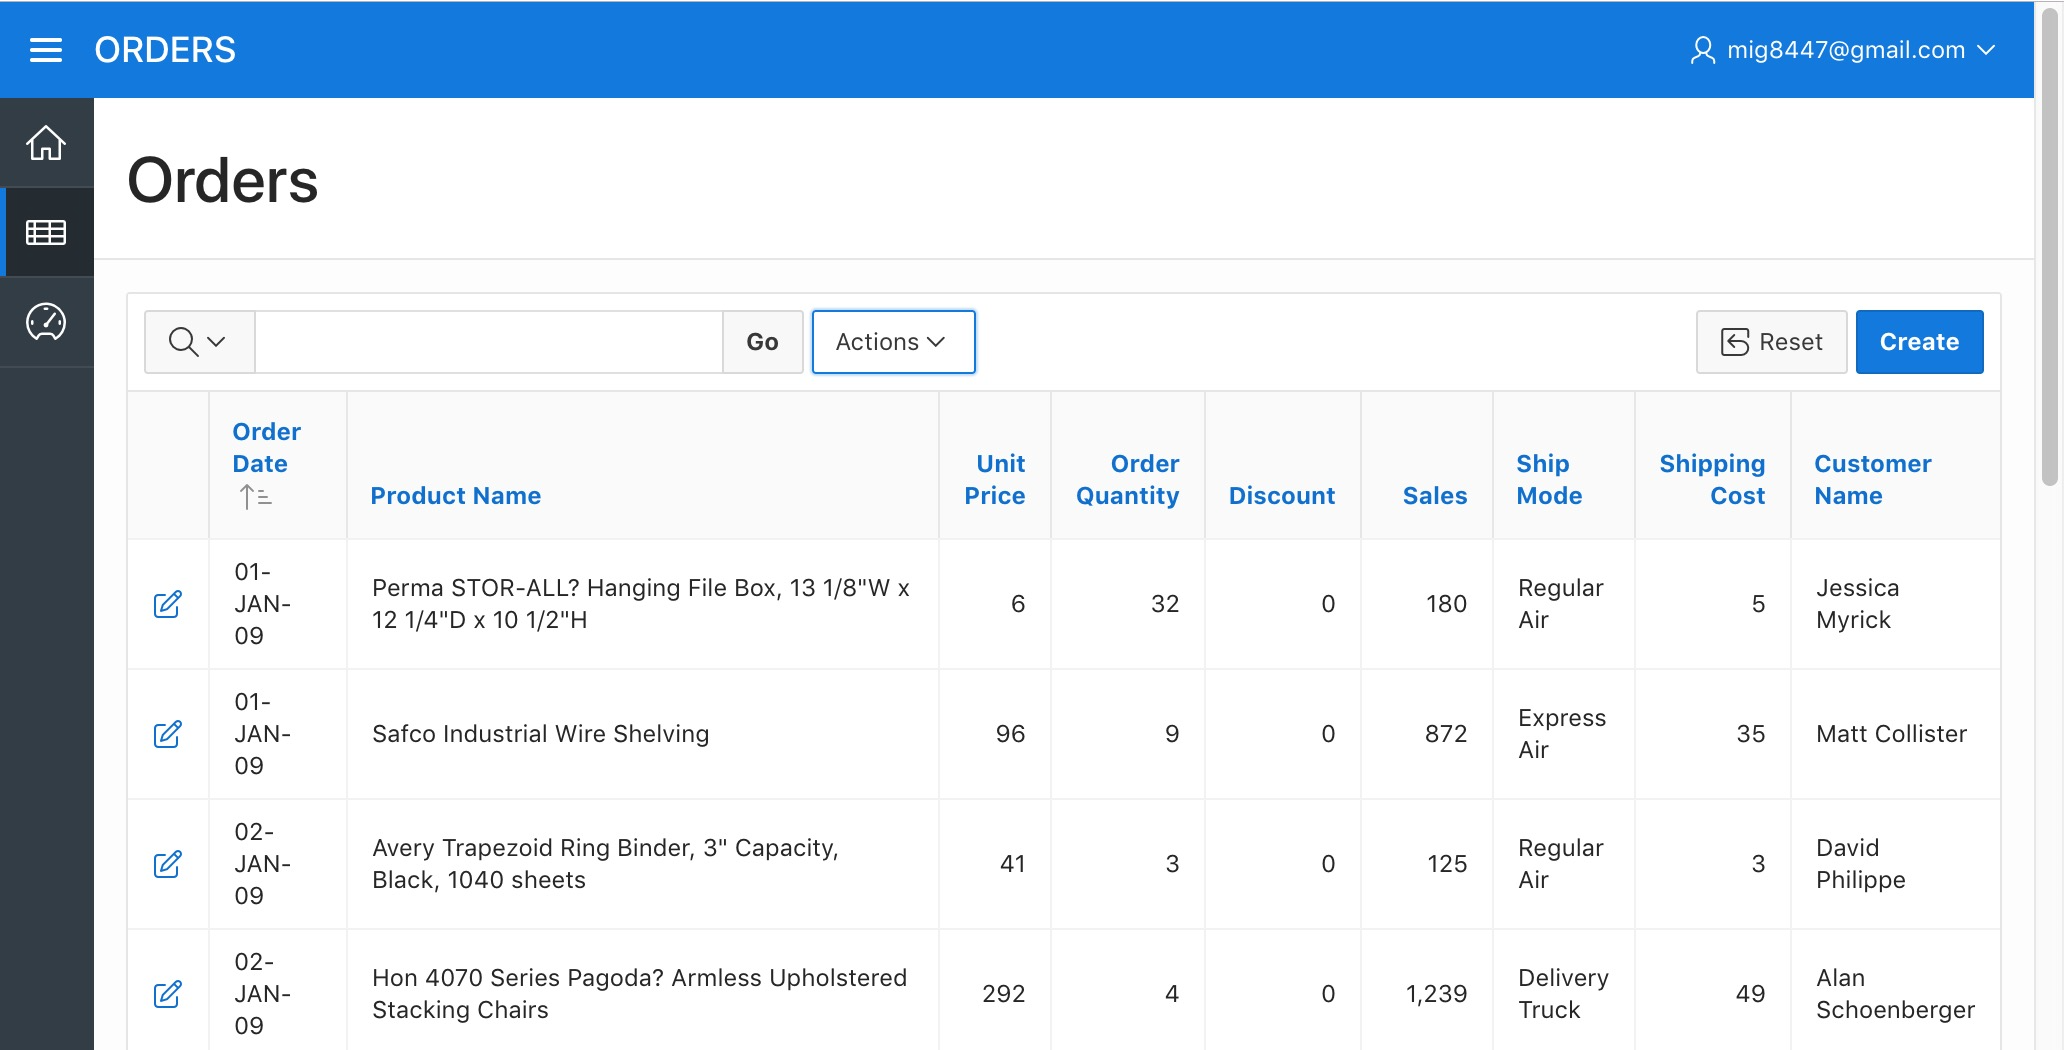
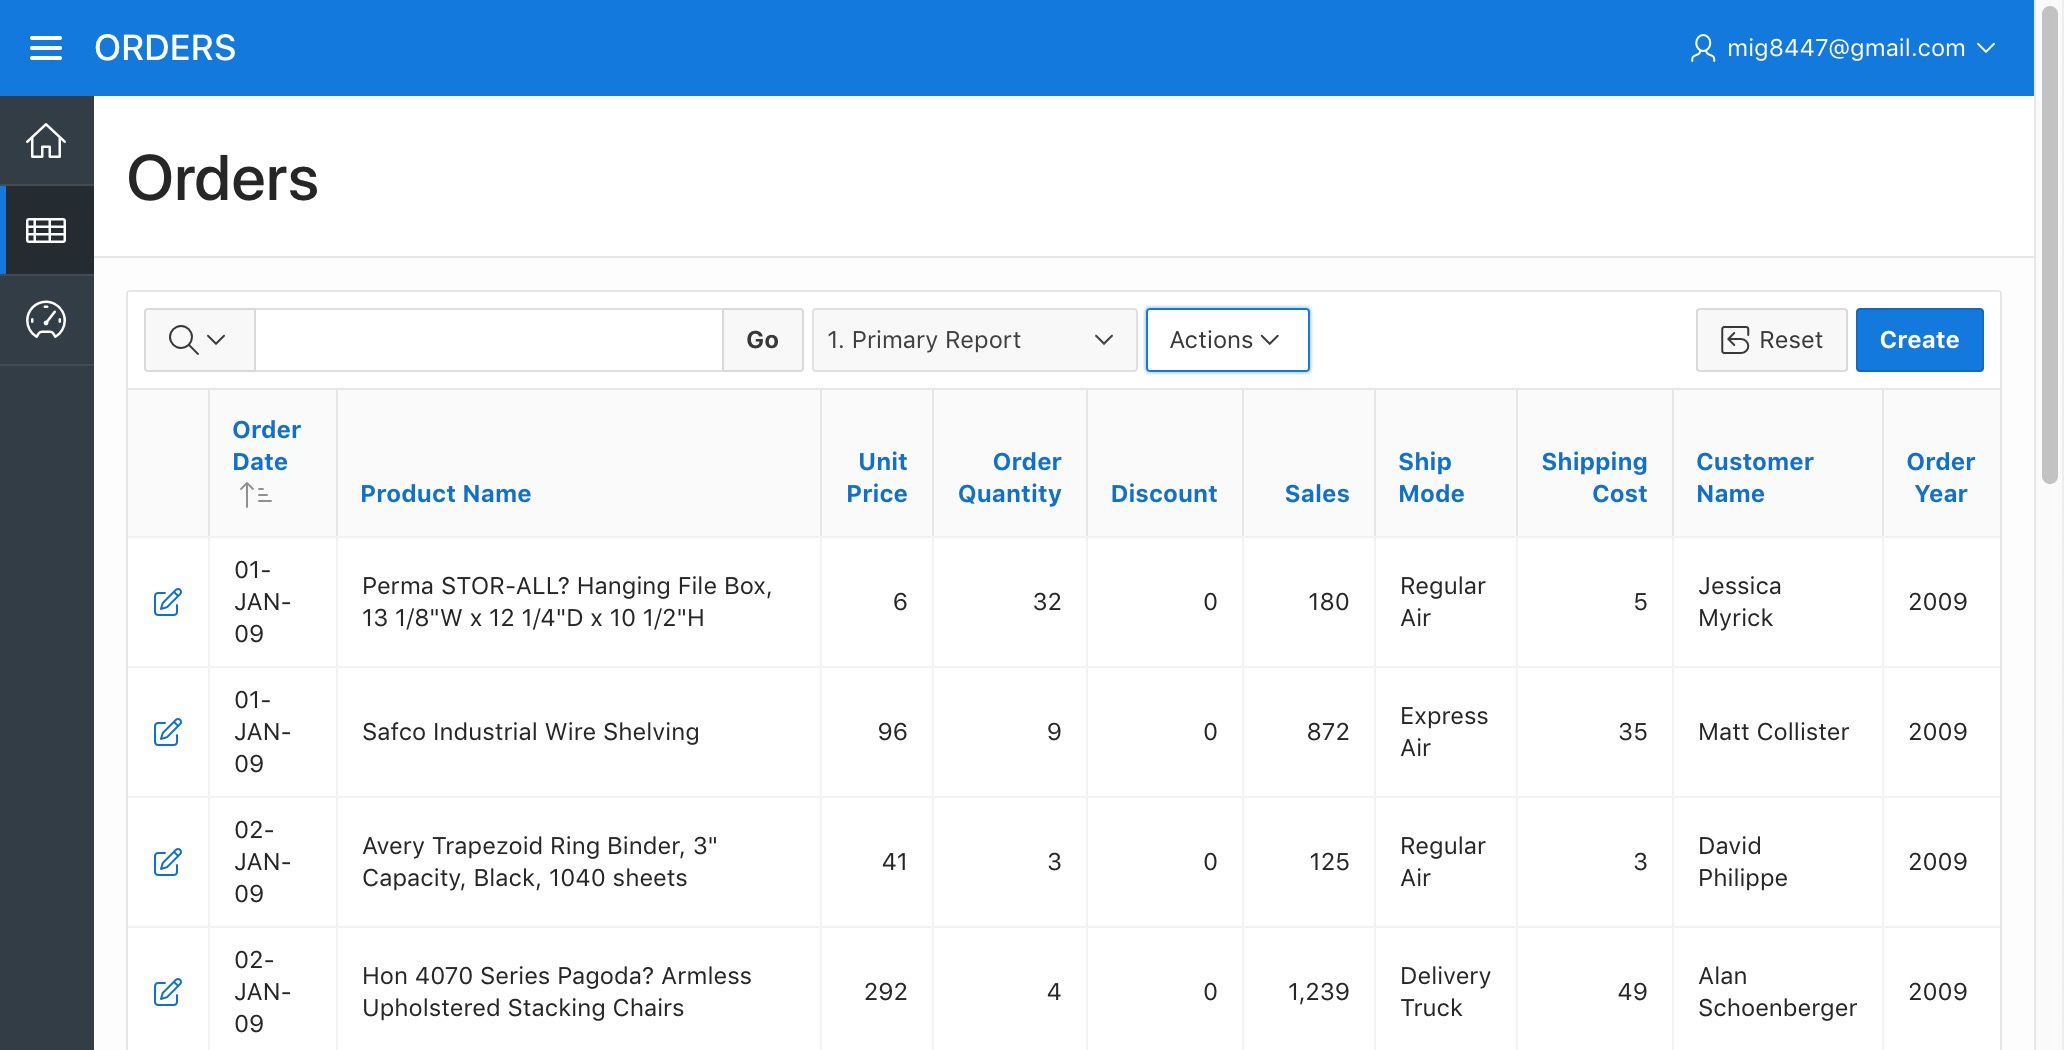
You will now see the Home Page, click on the "Orders" button from the page or from the navigation menu. Then a report with all the uploaded data will be shown.
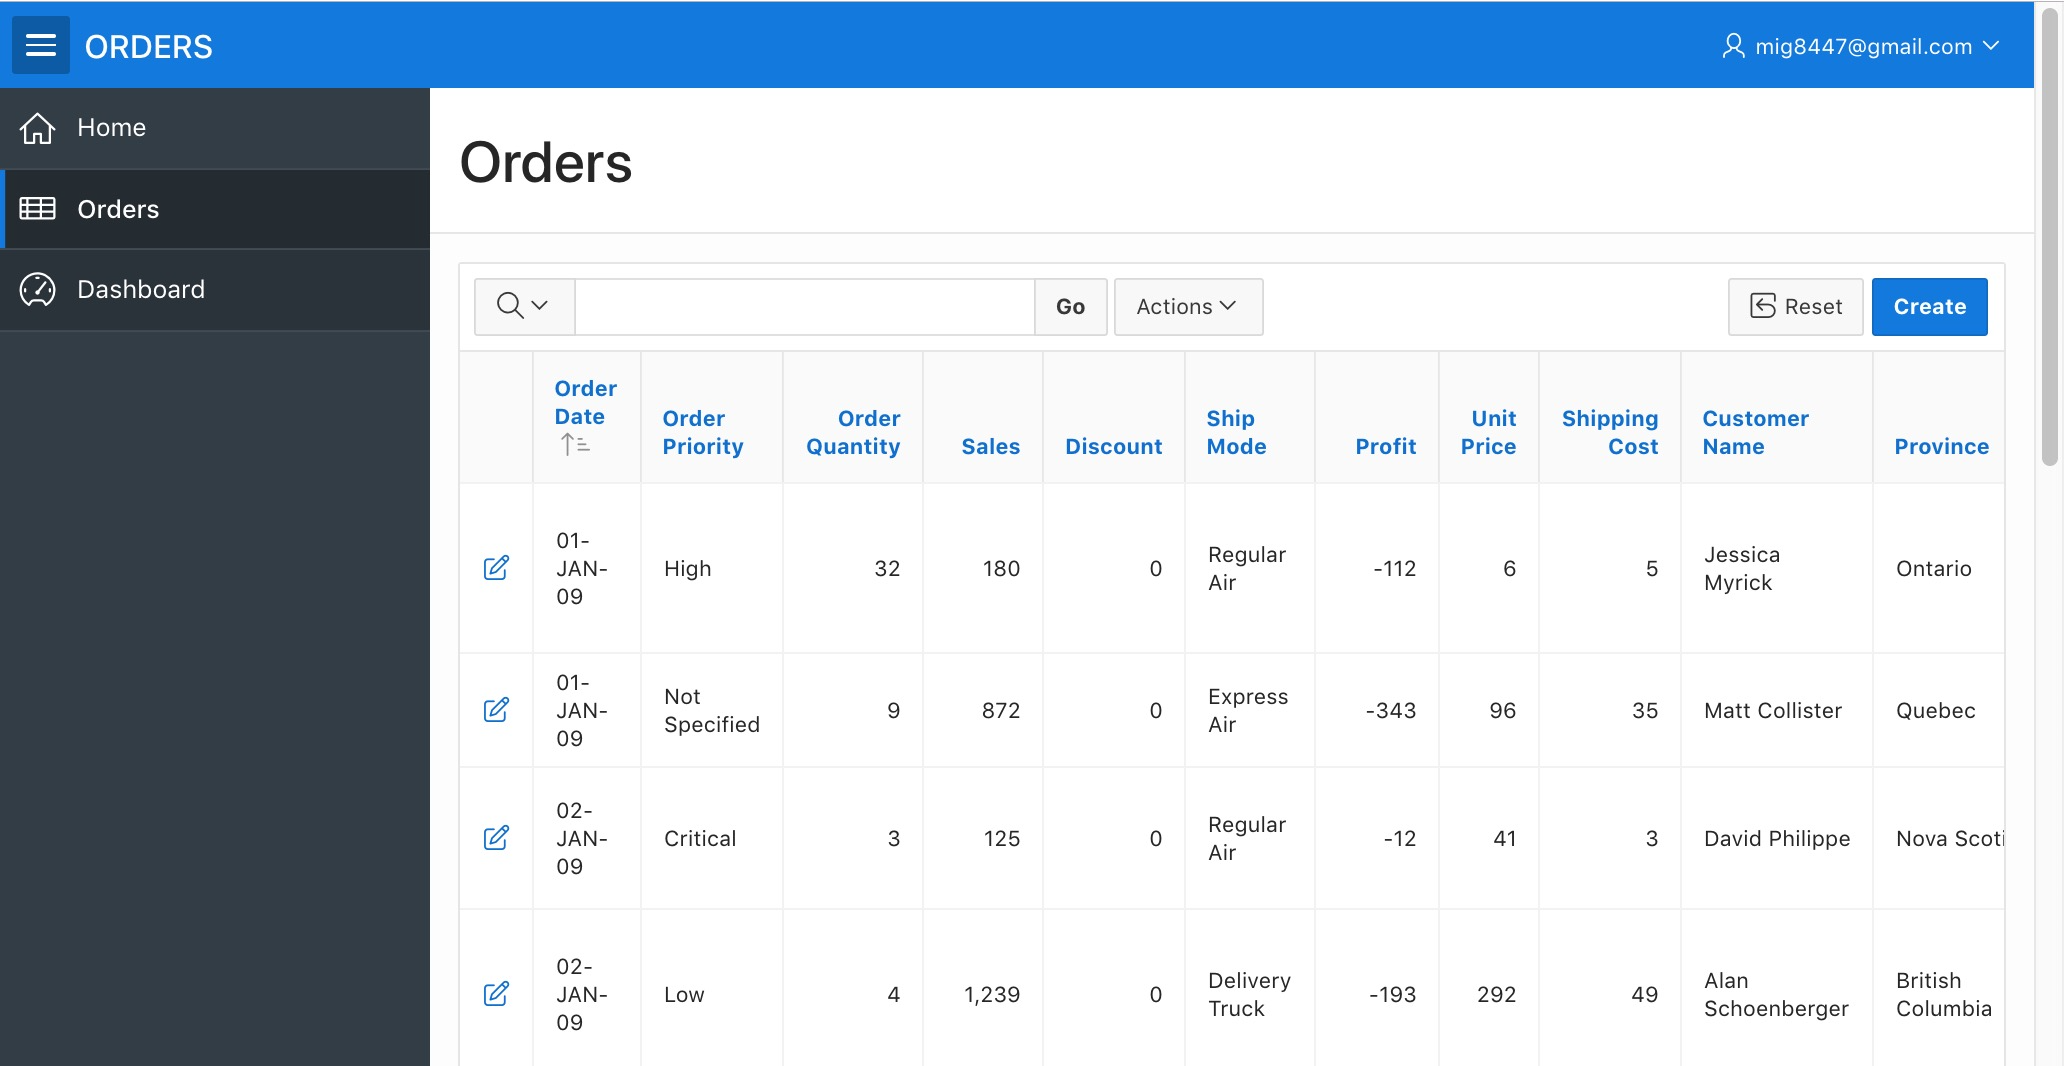
Doesn't seem like much, but wait to see the following. Now click on one of the pencil icons at the beginning of the rows.
A form will appear, this was created automatically based upon the uploaded data.
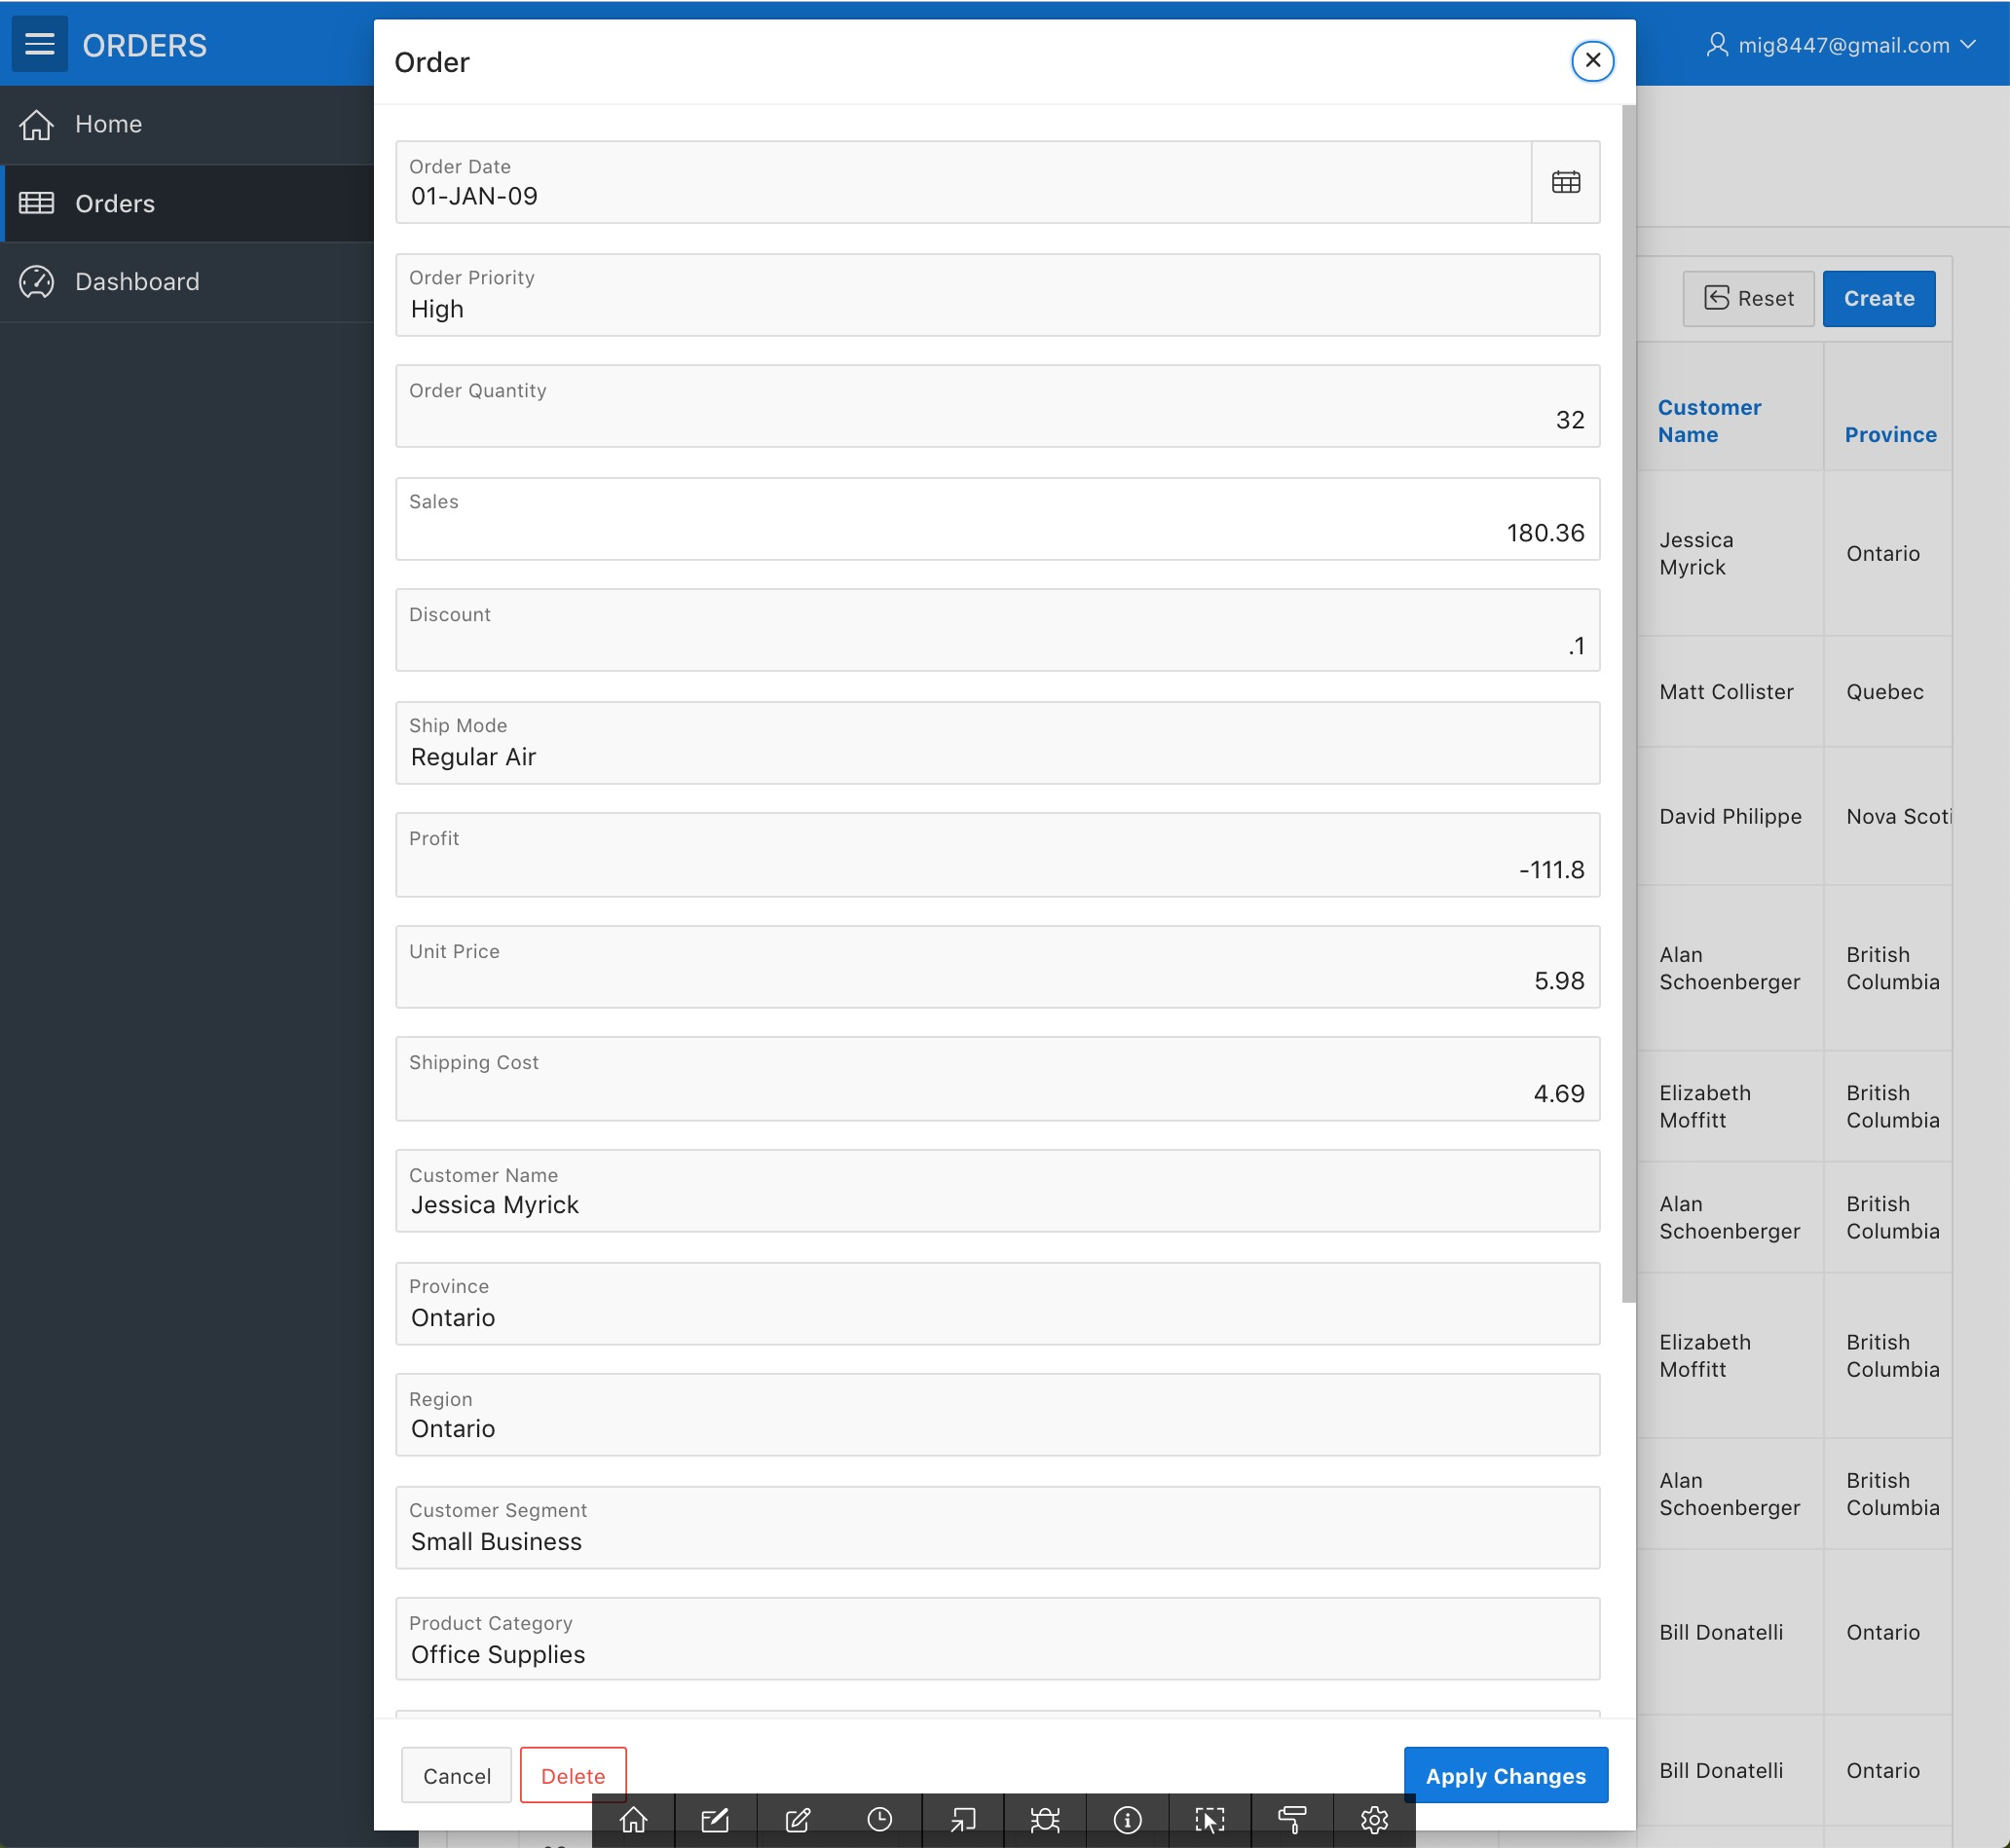
It will allow you to get new data into the database you now have. Scroll down and click on the "Cancel" button. We will now remove the clutter from our report.
Unleashing the Power of the APEX Interactive Reports
Sometimes there's data in the report we don't always need to see. With the help of APEX's interactive reports we can select the data columns we want to see. Click in the "Actions" menu next to the search bar and then pick the "Columns" option from the menu.

A dialog will appear. Click on the "«" button displayed on the dialog, this will hide all the columns in the report.

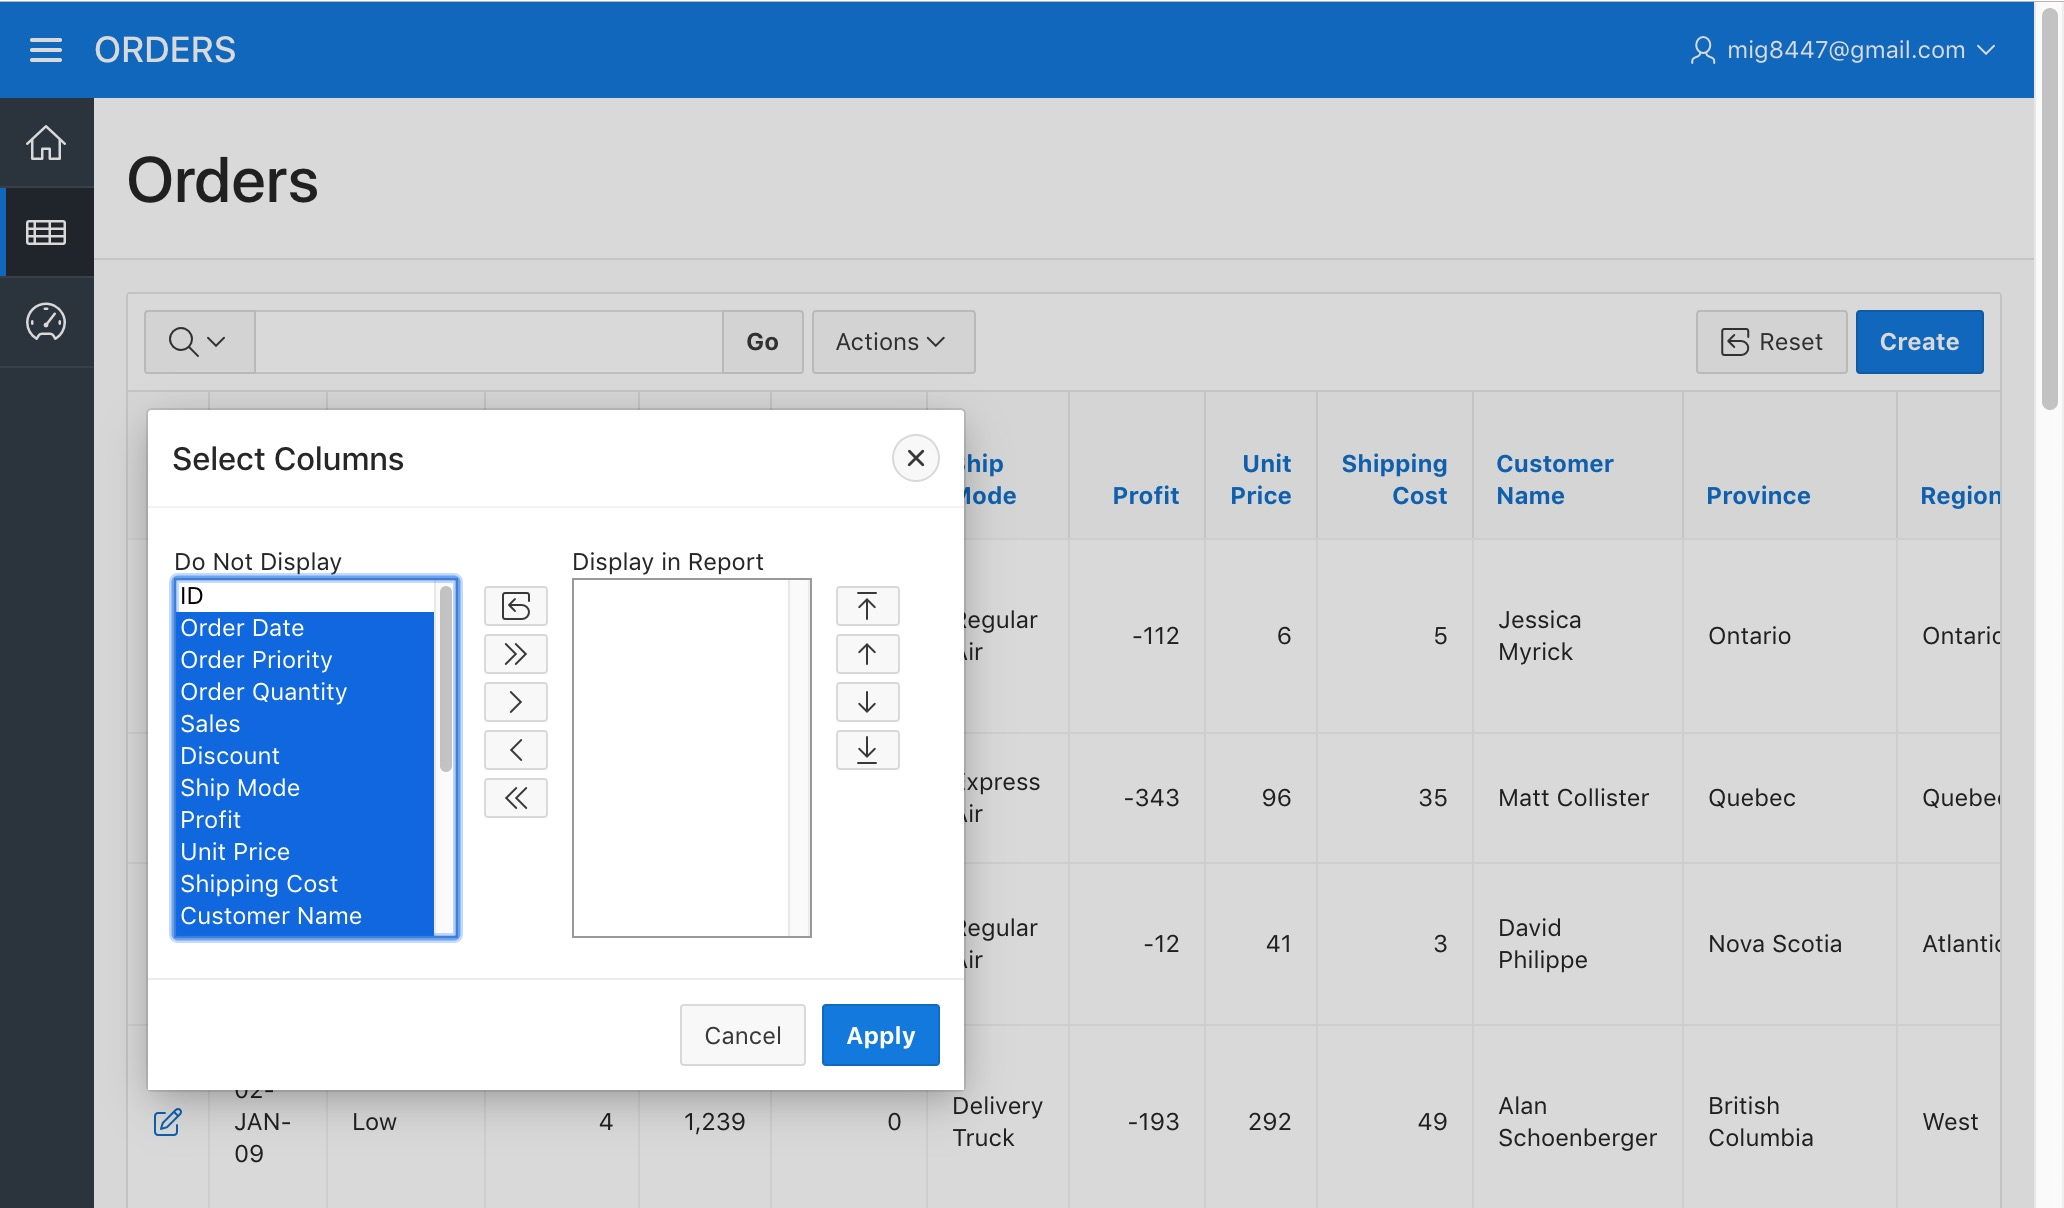
We'll now pick the columns we want by selecting their names (You can select multiple items with Shift + Click) in the "Do Not Display" column and clicking on the ">" button. Pick at least Order Date, Product Name, and Sales to be displayed.
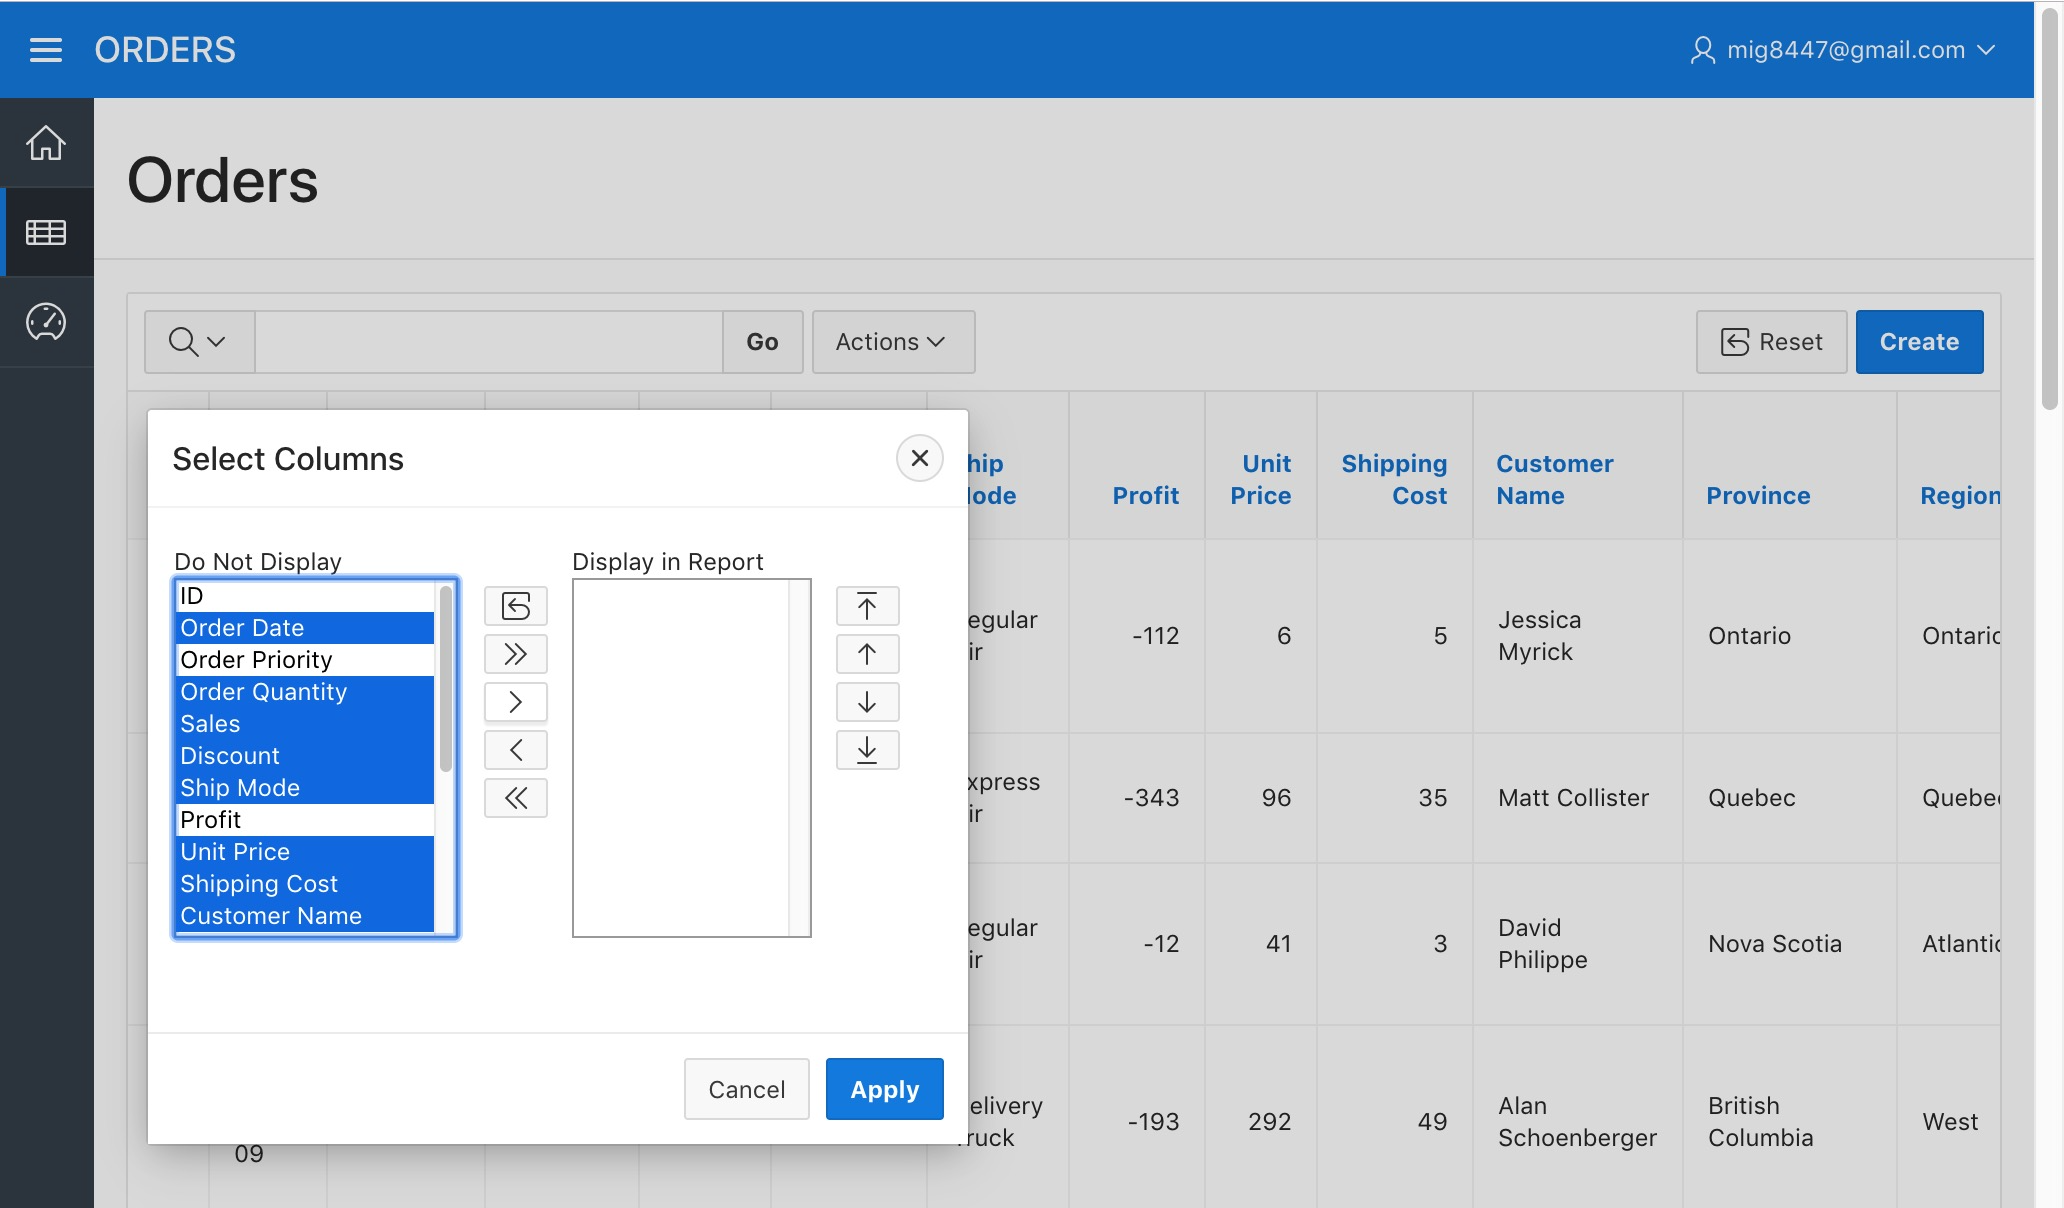

You can reorder the names by clicking the icons located to the right of the "Display in Report" column
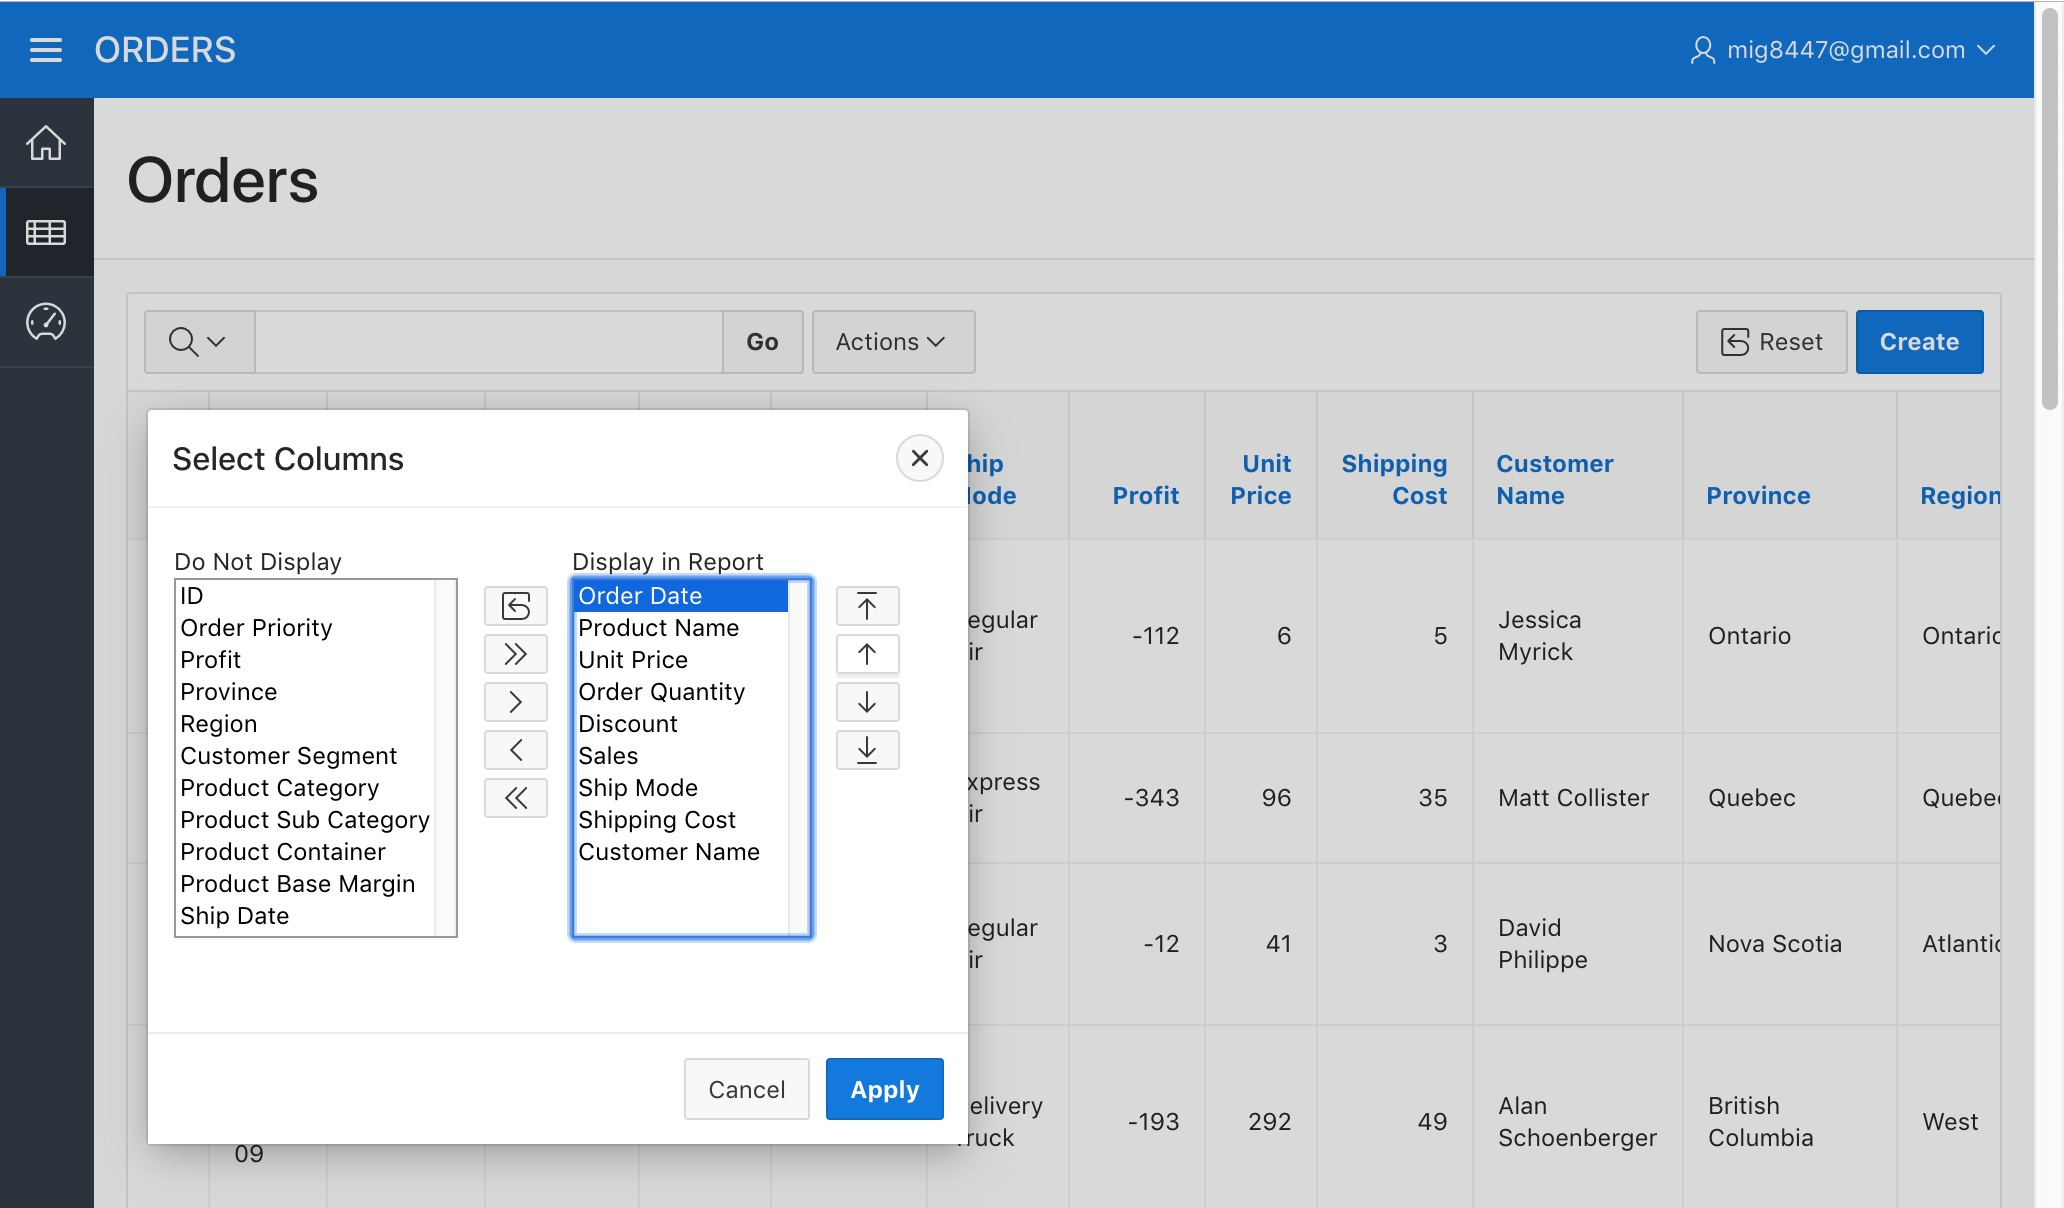
Click on the "Apply" button. A more simplified report will appear.
Lets use the "Actions" menu once more by picking the "Save Report" option from the sub-menu "Report".
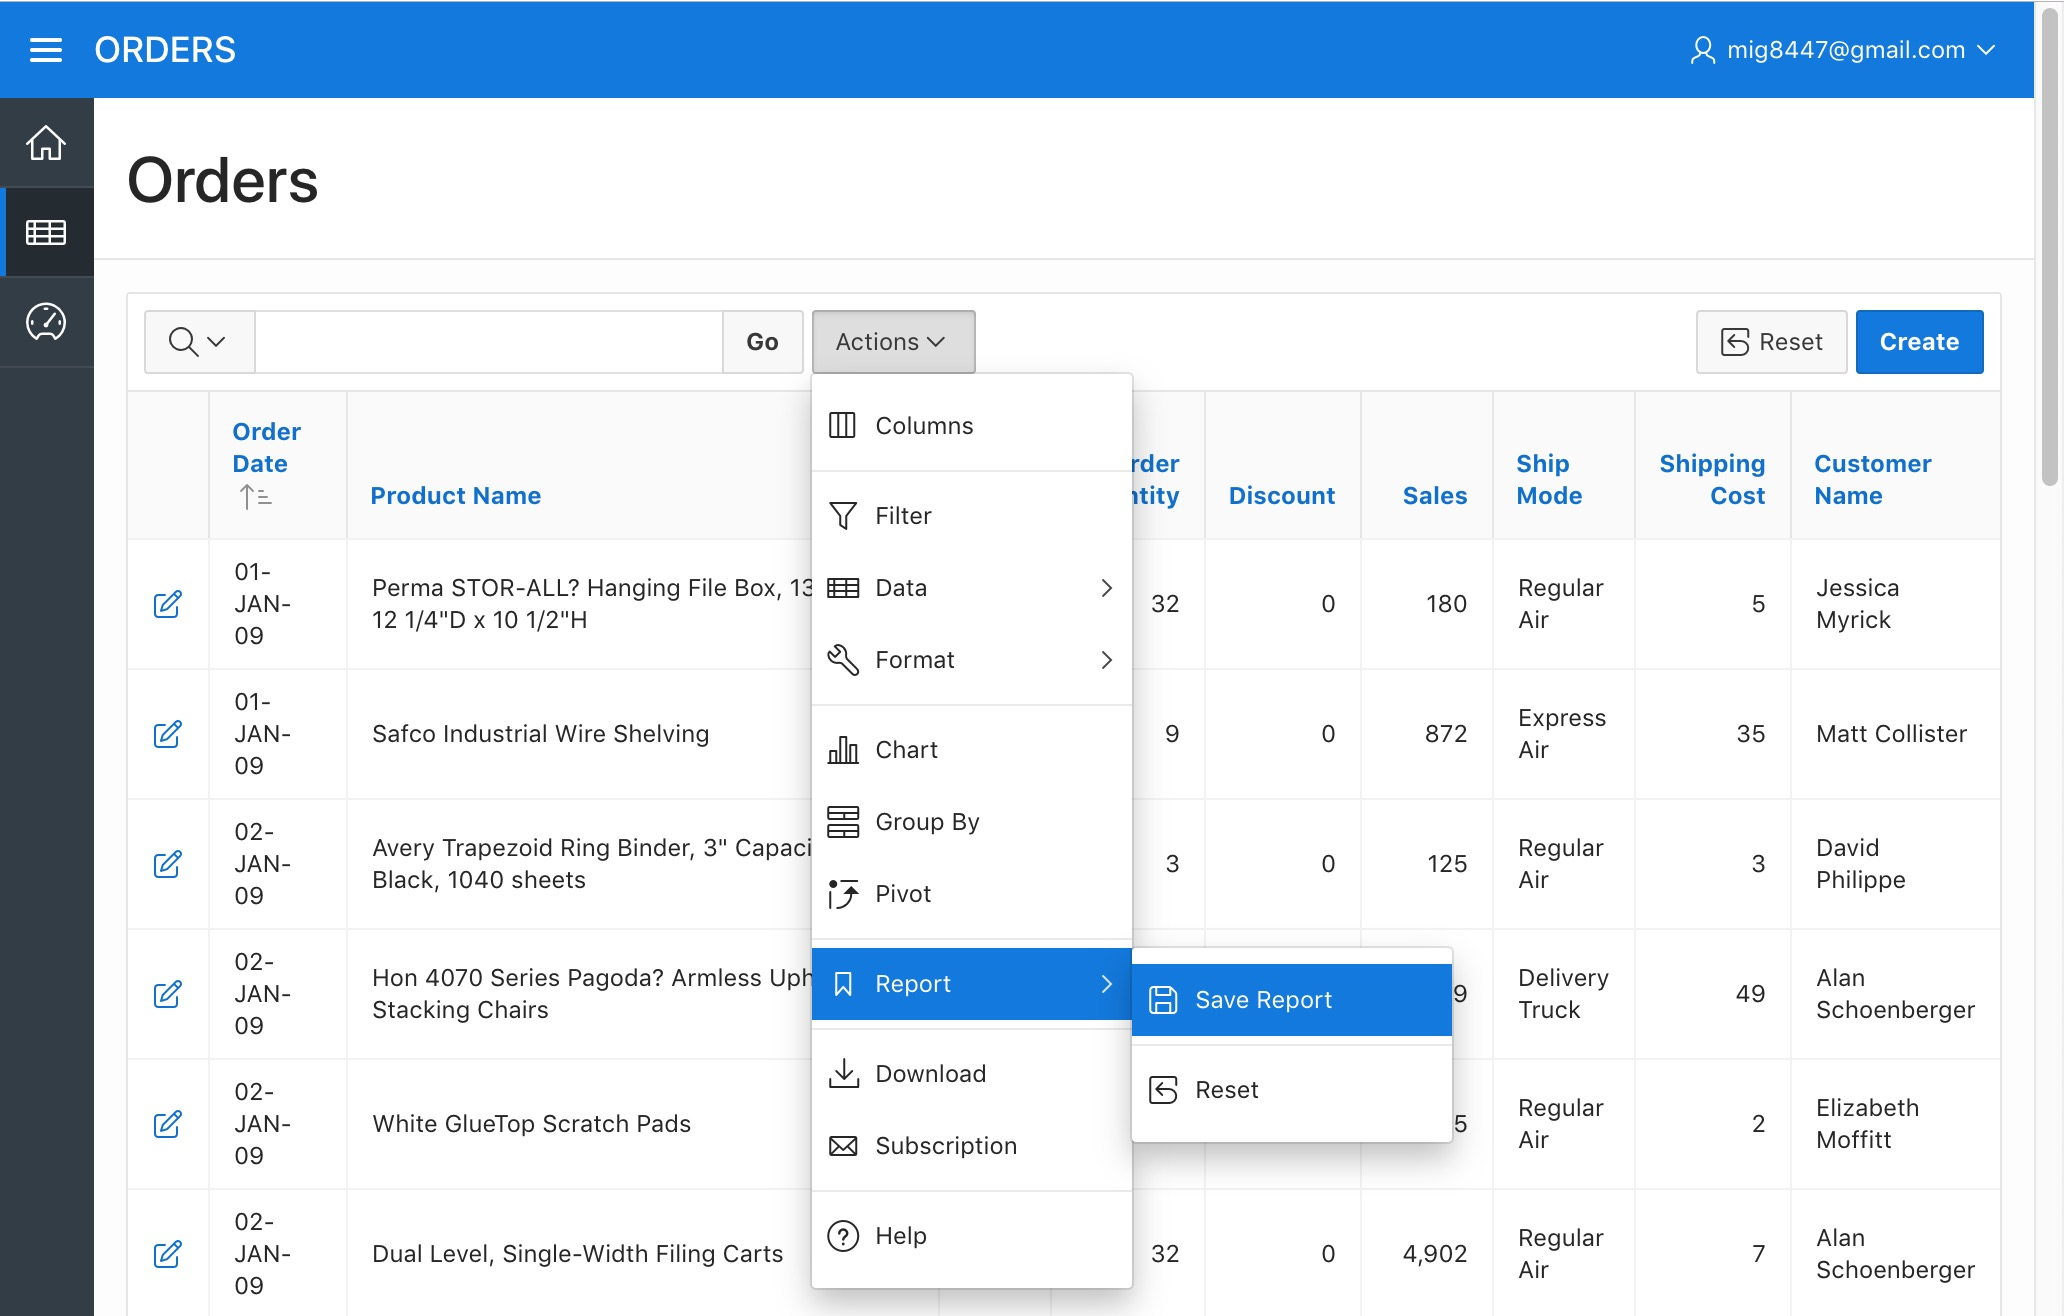
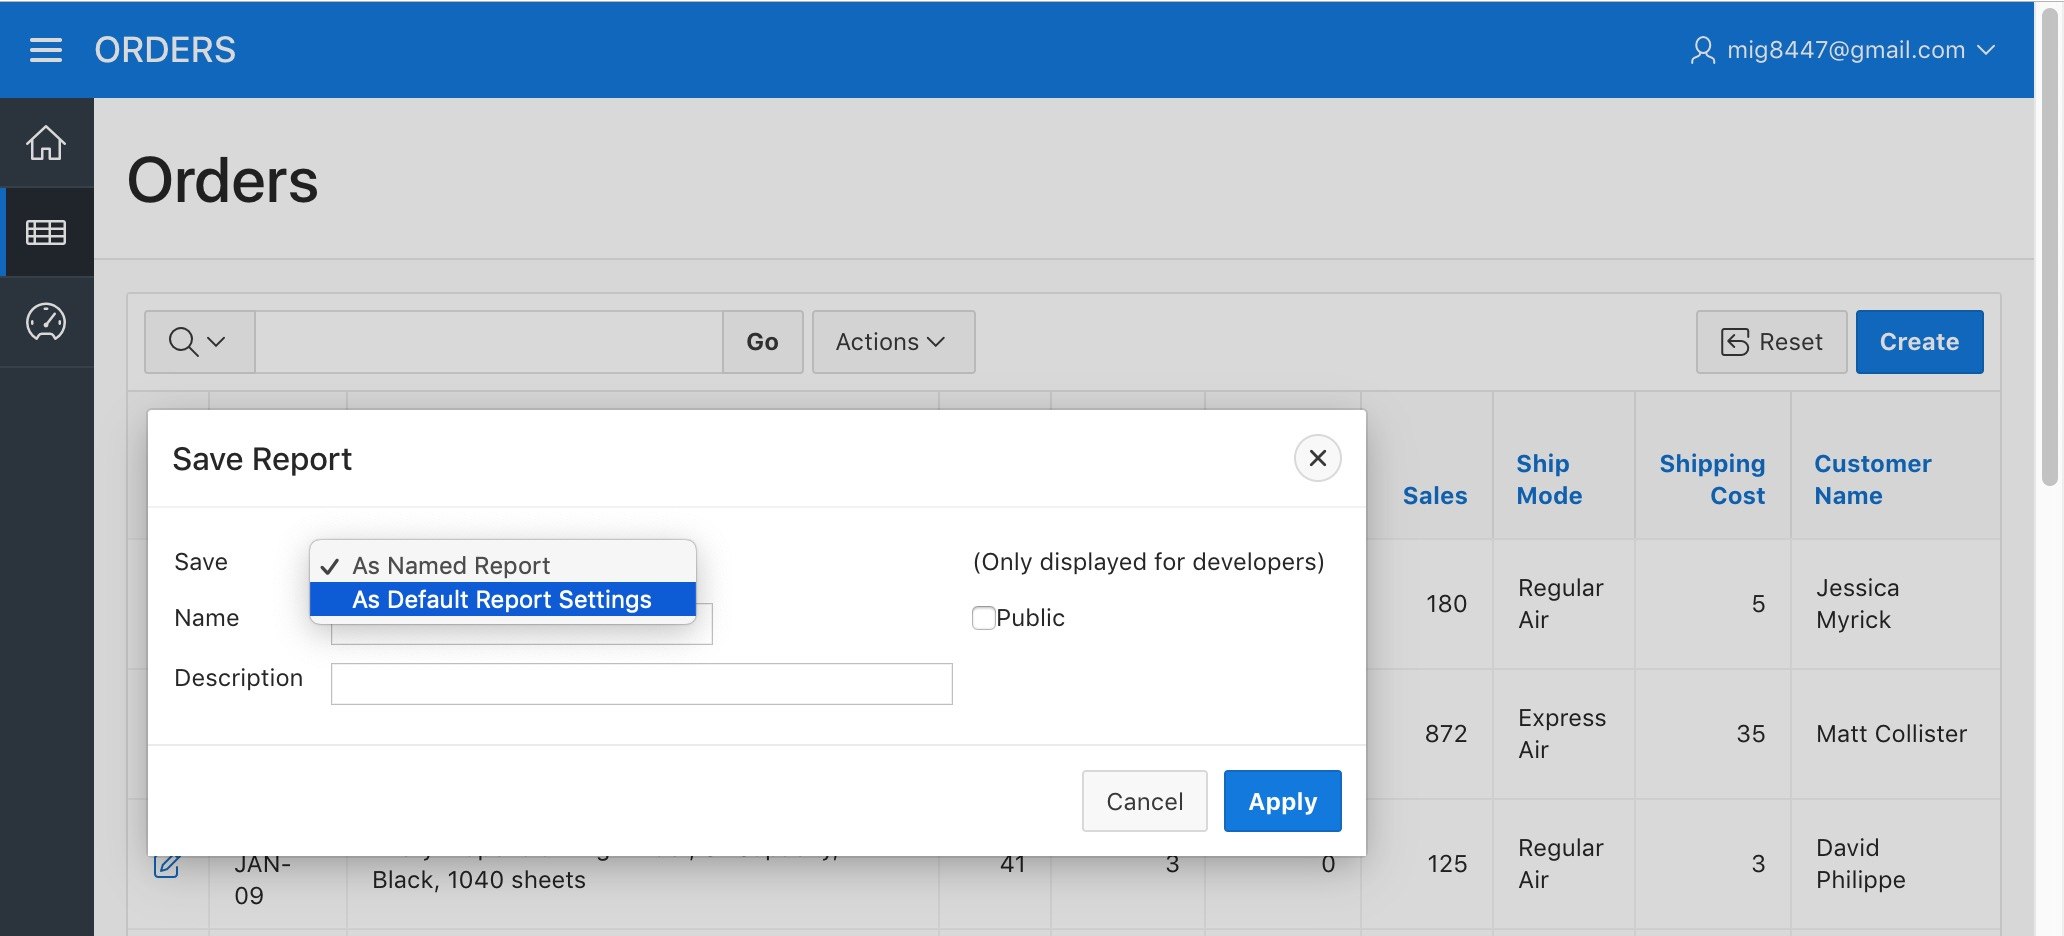
A dialog will appear. Pick the "As Default Report Settings" option on the "Save" field.
The dialog will change. Select the "Primary" option and click "Apply".
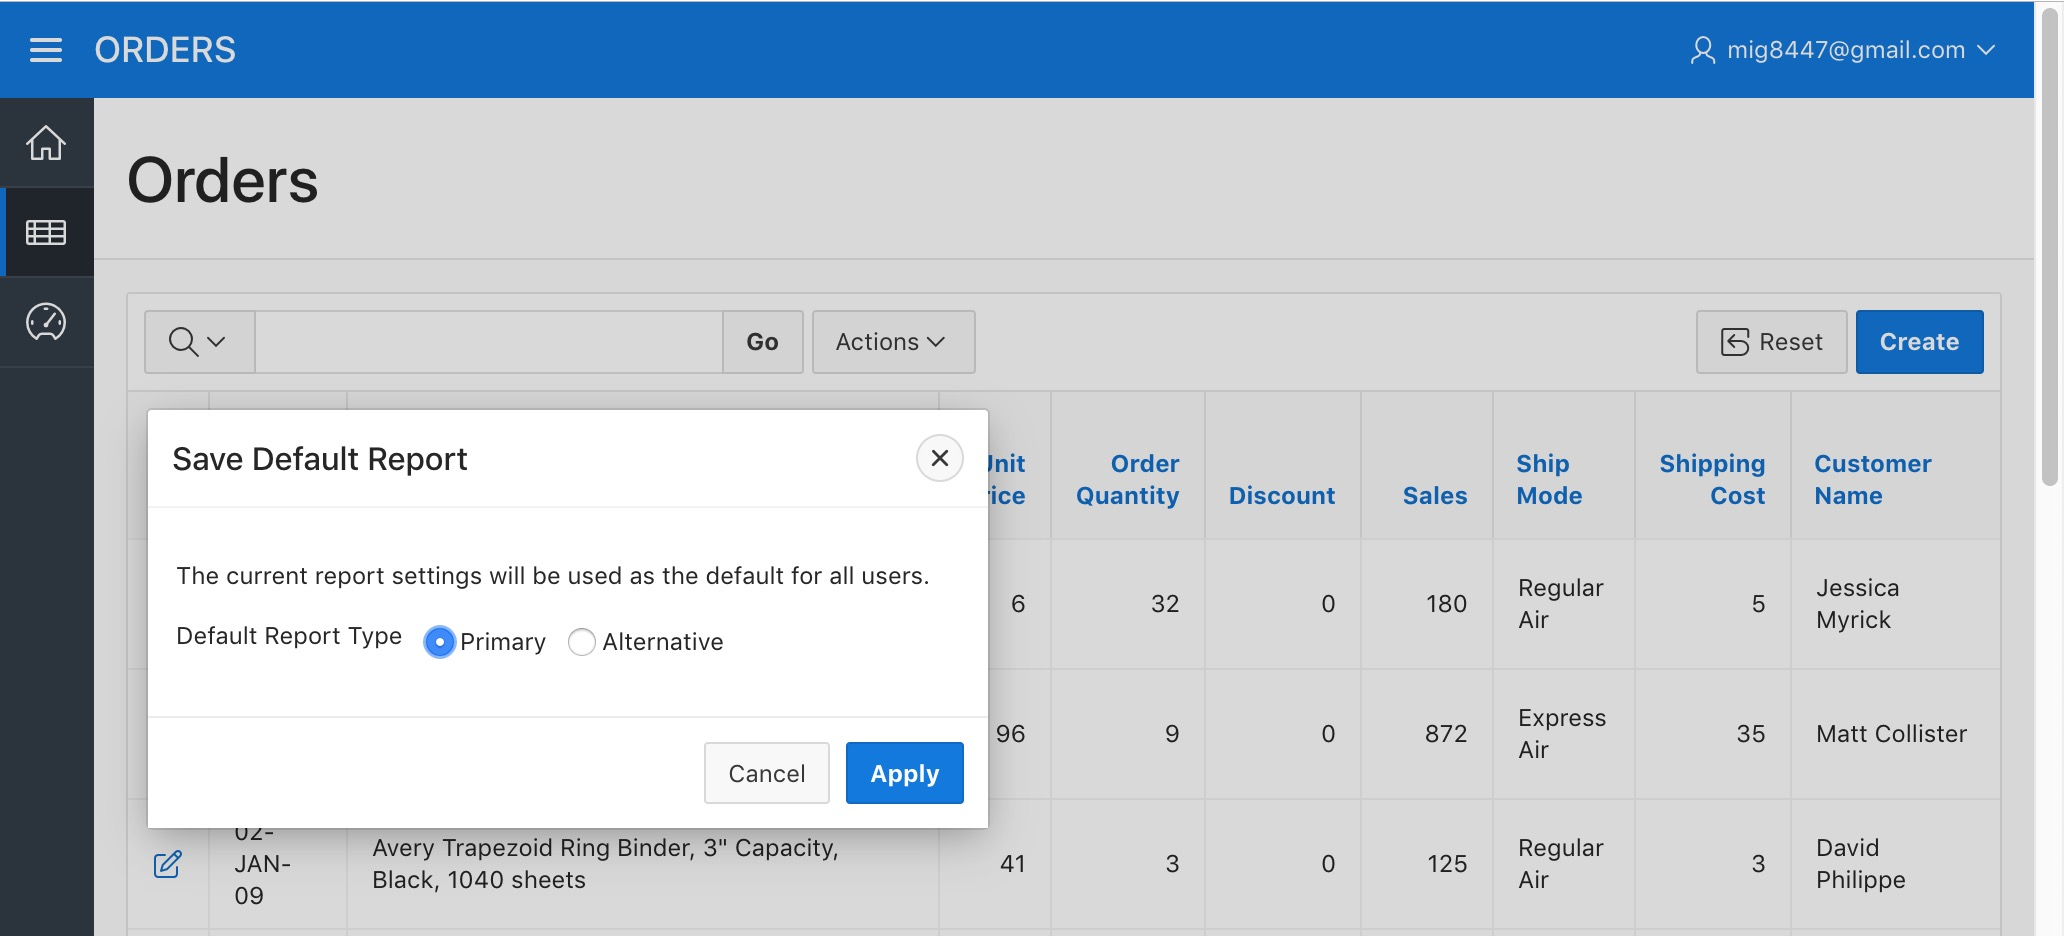
By doing this we're telling APEX to make this simplified view of our table the default view for all the Application users. Now, when someone enters the Orders page they will see the report as it is now. Lets make it more interesting.
Data Computations - Normalizing the Product Names
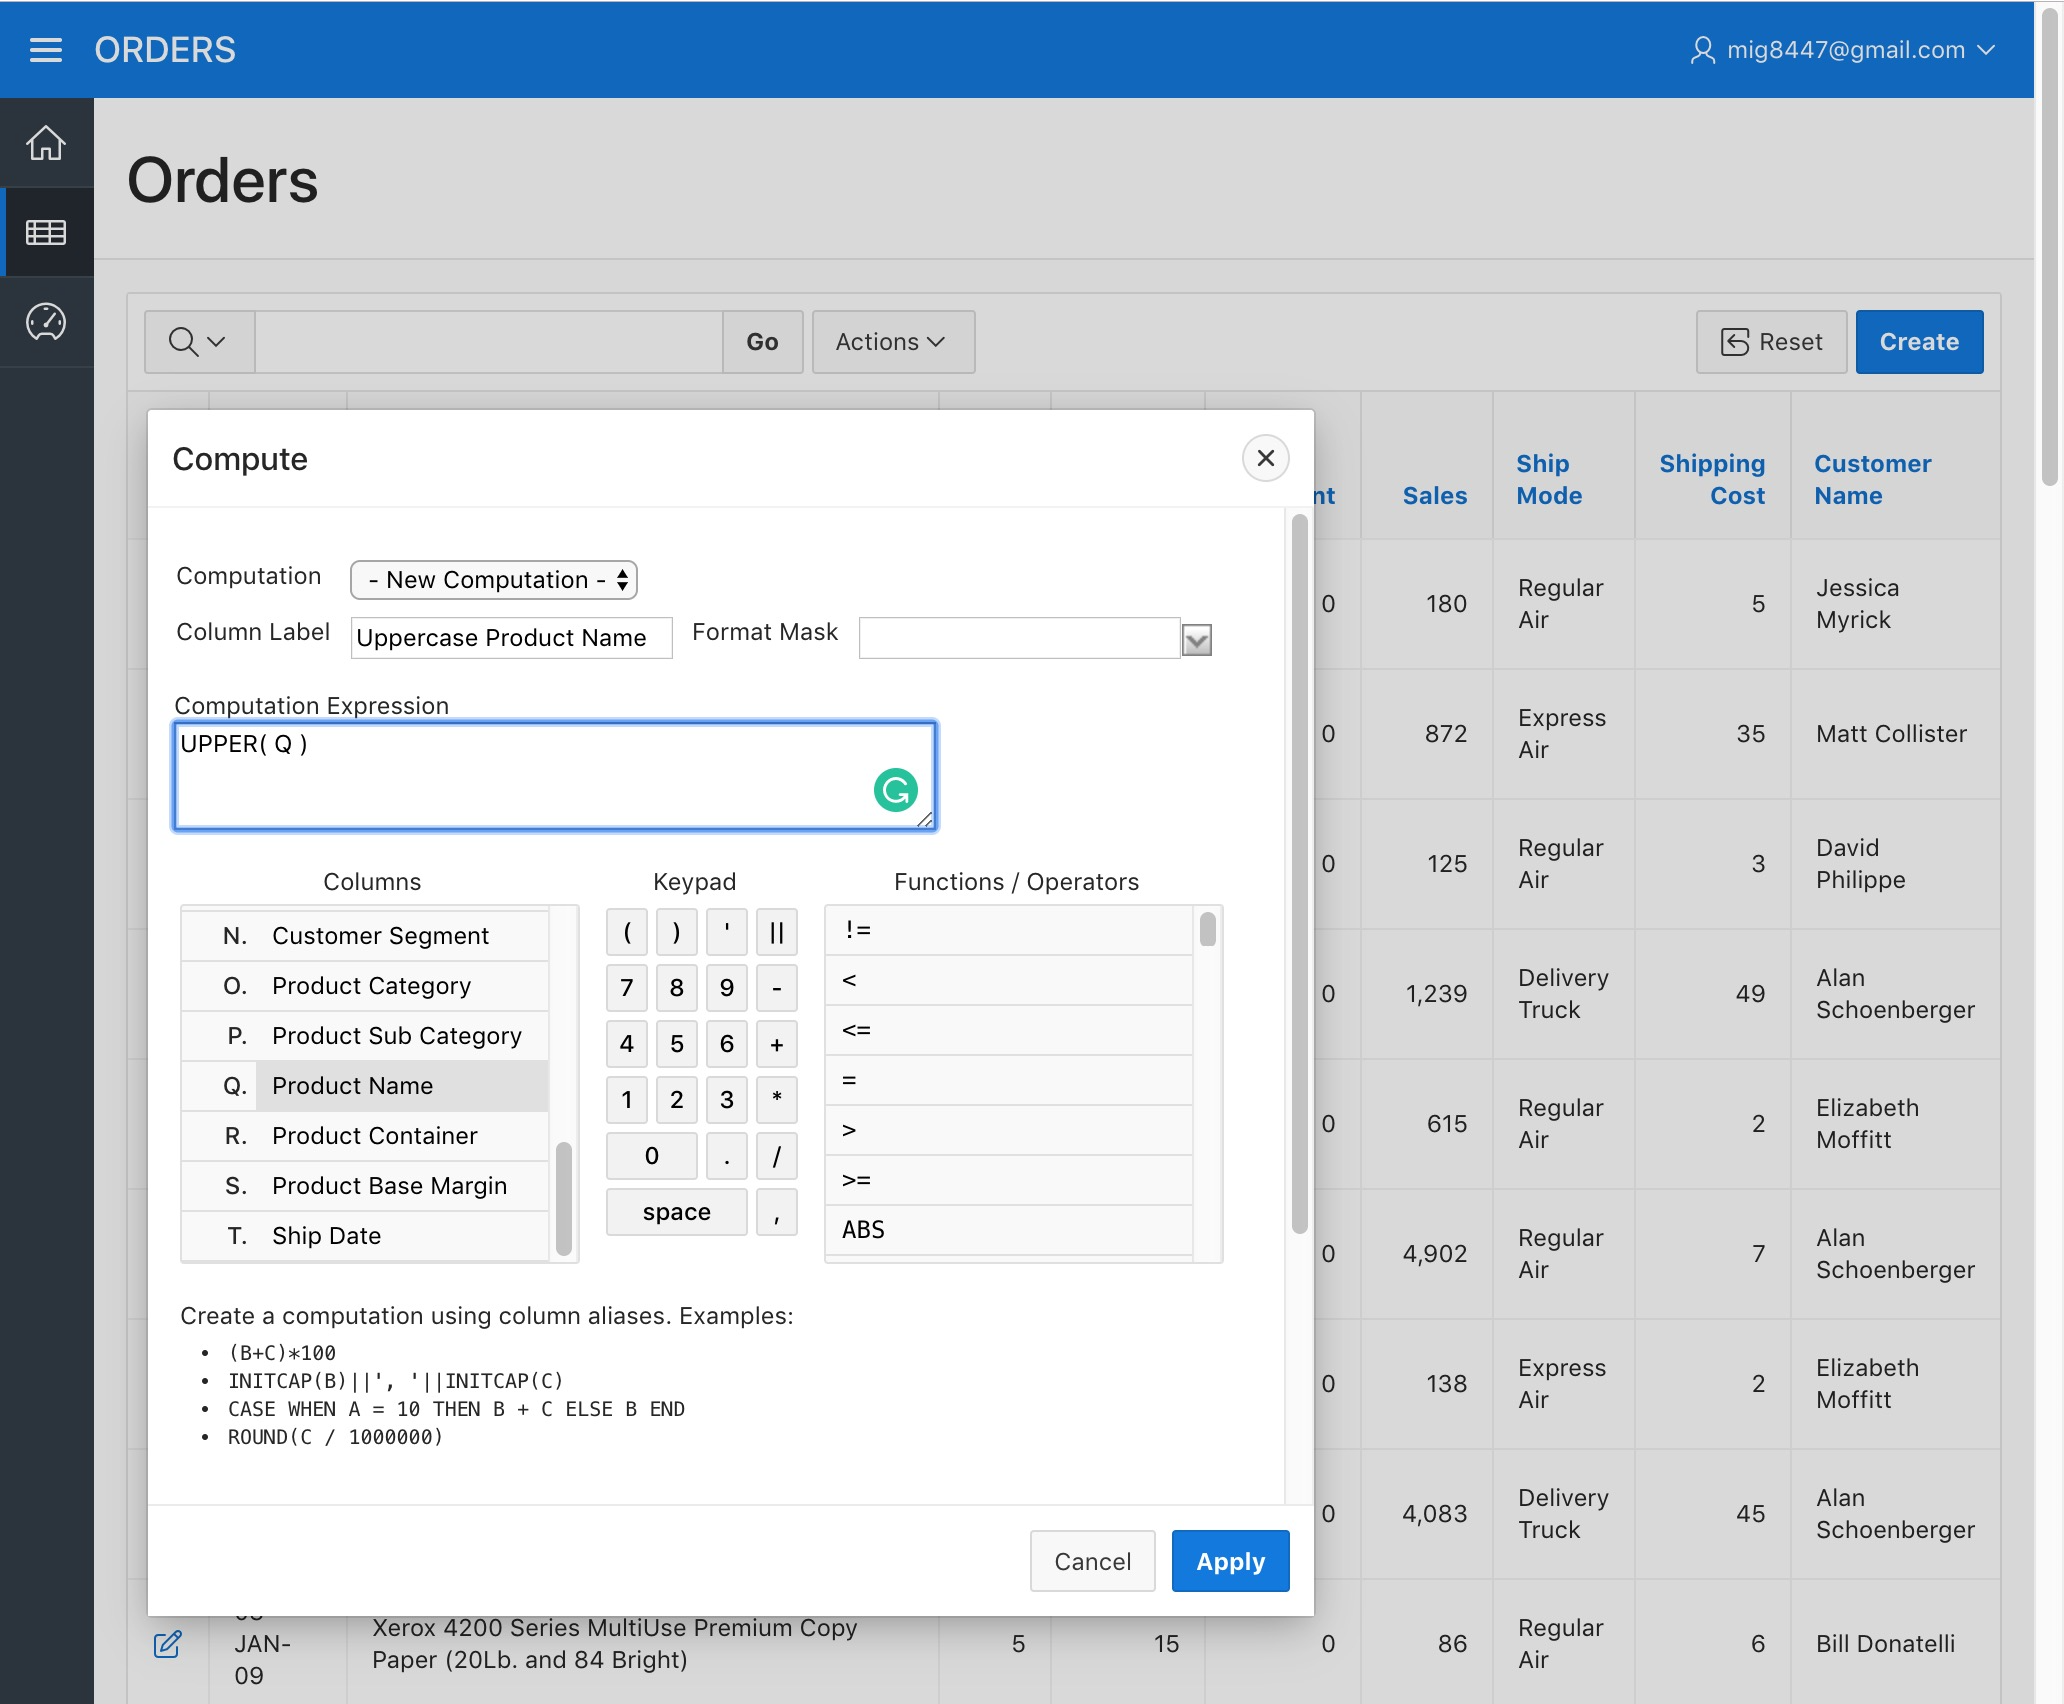
Click on the "Actions" menu once more and hover over the "Data" option, then pick the "Compute" option in the sub-menu. We will now generate a couple of columns that are said to be "computed", meaning that such columns will have calculated values, normally depending on the original report columns.

A dialog will appear. Enter "Uppercase Product Name" as the "Column Heading" and now type the following as the "Computation Expression":
UPPER( Q )
Make sure the Q letter corresponds to the "Product Name" column under the "Columns" list, if it doesn't, then replace it with the letter that corresponds to it. You can find all the supported operations for these "Computations" under the "Functions / Operations" list. Click "Apply"
We now see the "Uppercase Product Name" at the right side of our report.

This column will be useful because the Orders.csv file contained product names that were just different in the character case used, some product names, although the same were captured all uppercase, some with lower case and some with mixed case. With the "Uppercase Product Name" column we have something that we know will be consistent independent of the character case it is written on.
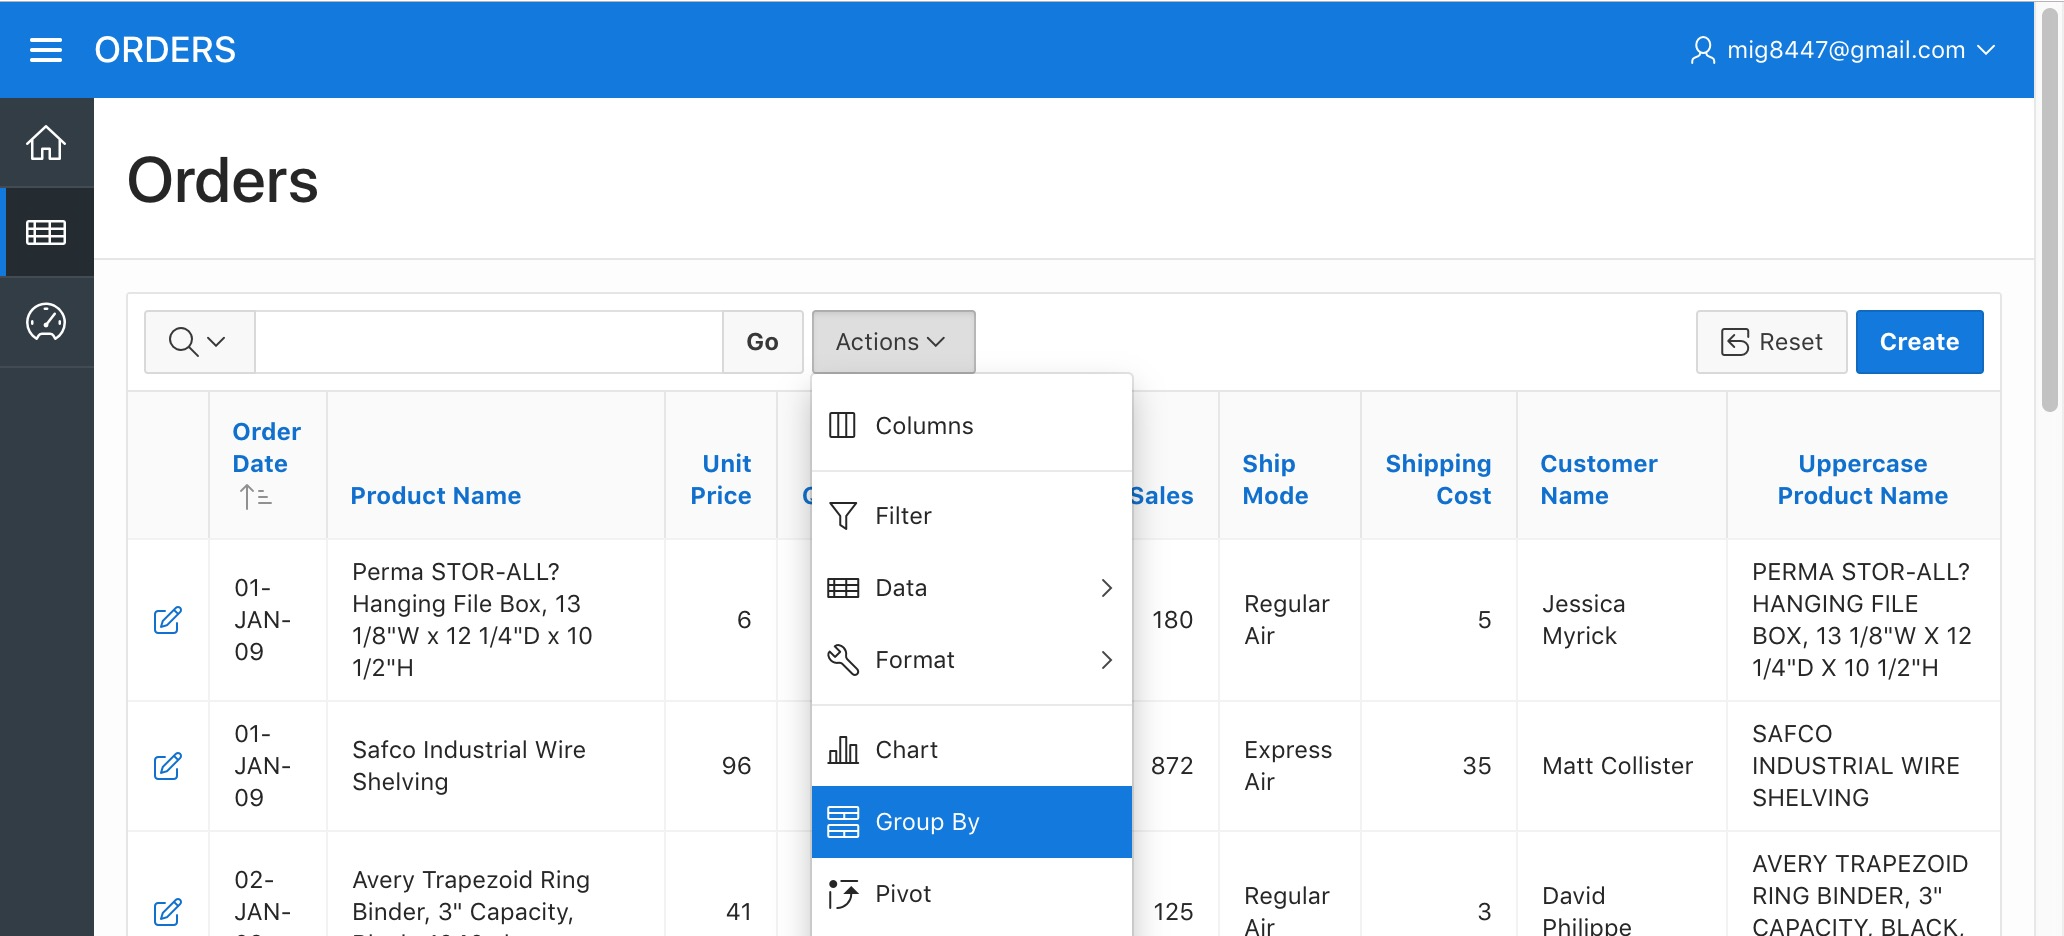
Can we have a "Sales by Product" report? Yes. Interactive Reports allow us to group things by one or more columns.
Grouping Data - Creating a "Sales by Product" Report
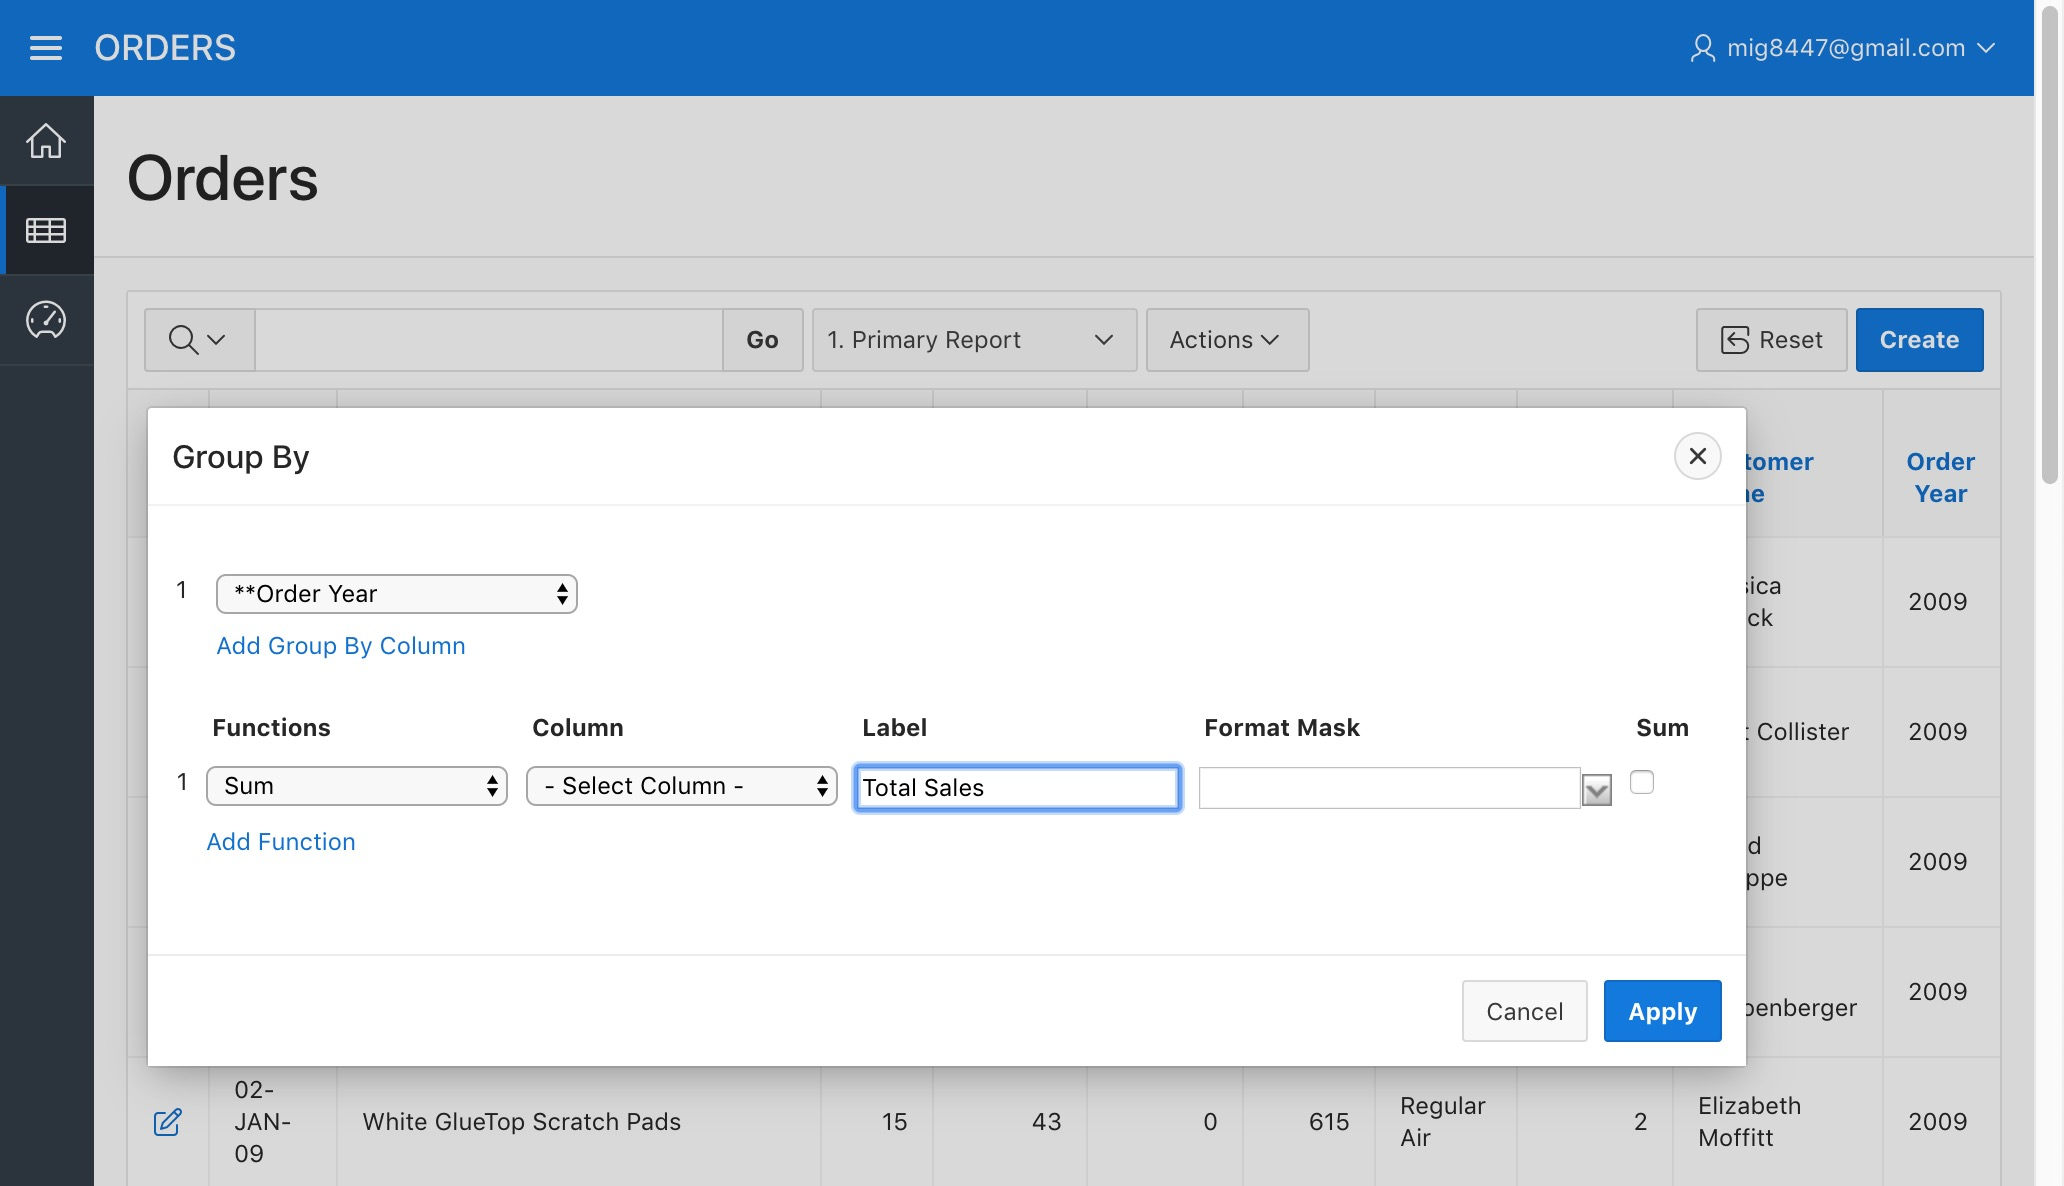
Click on the "Actions" menu and select the "Group By" option.
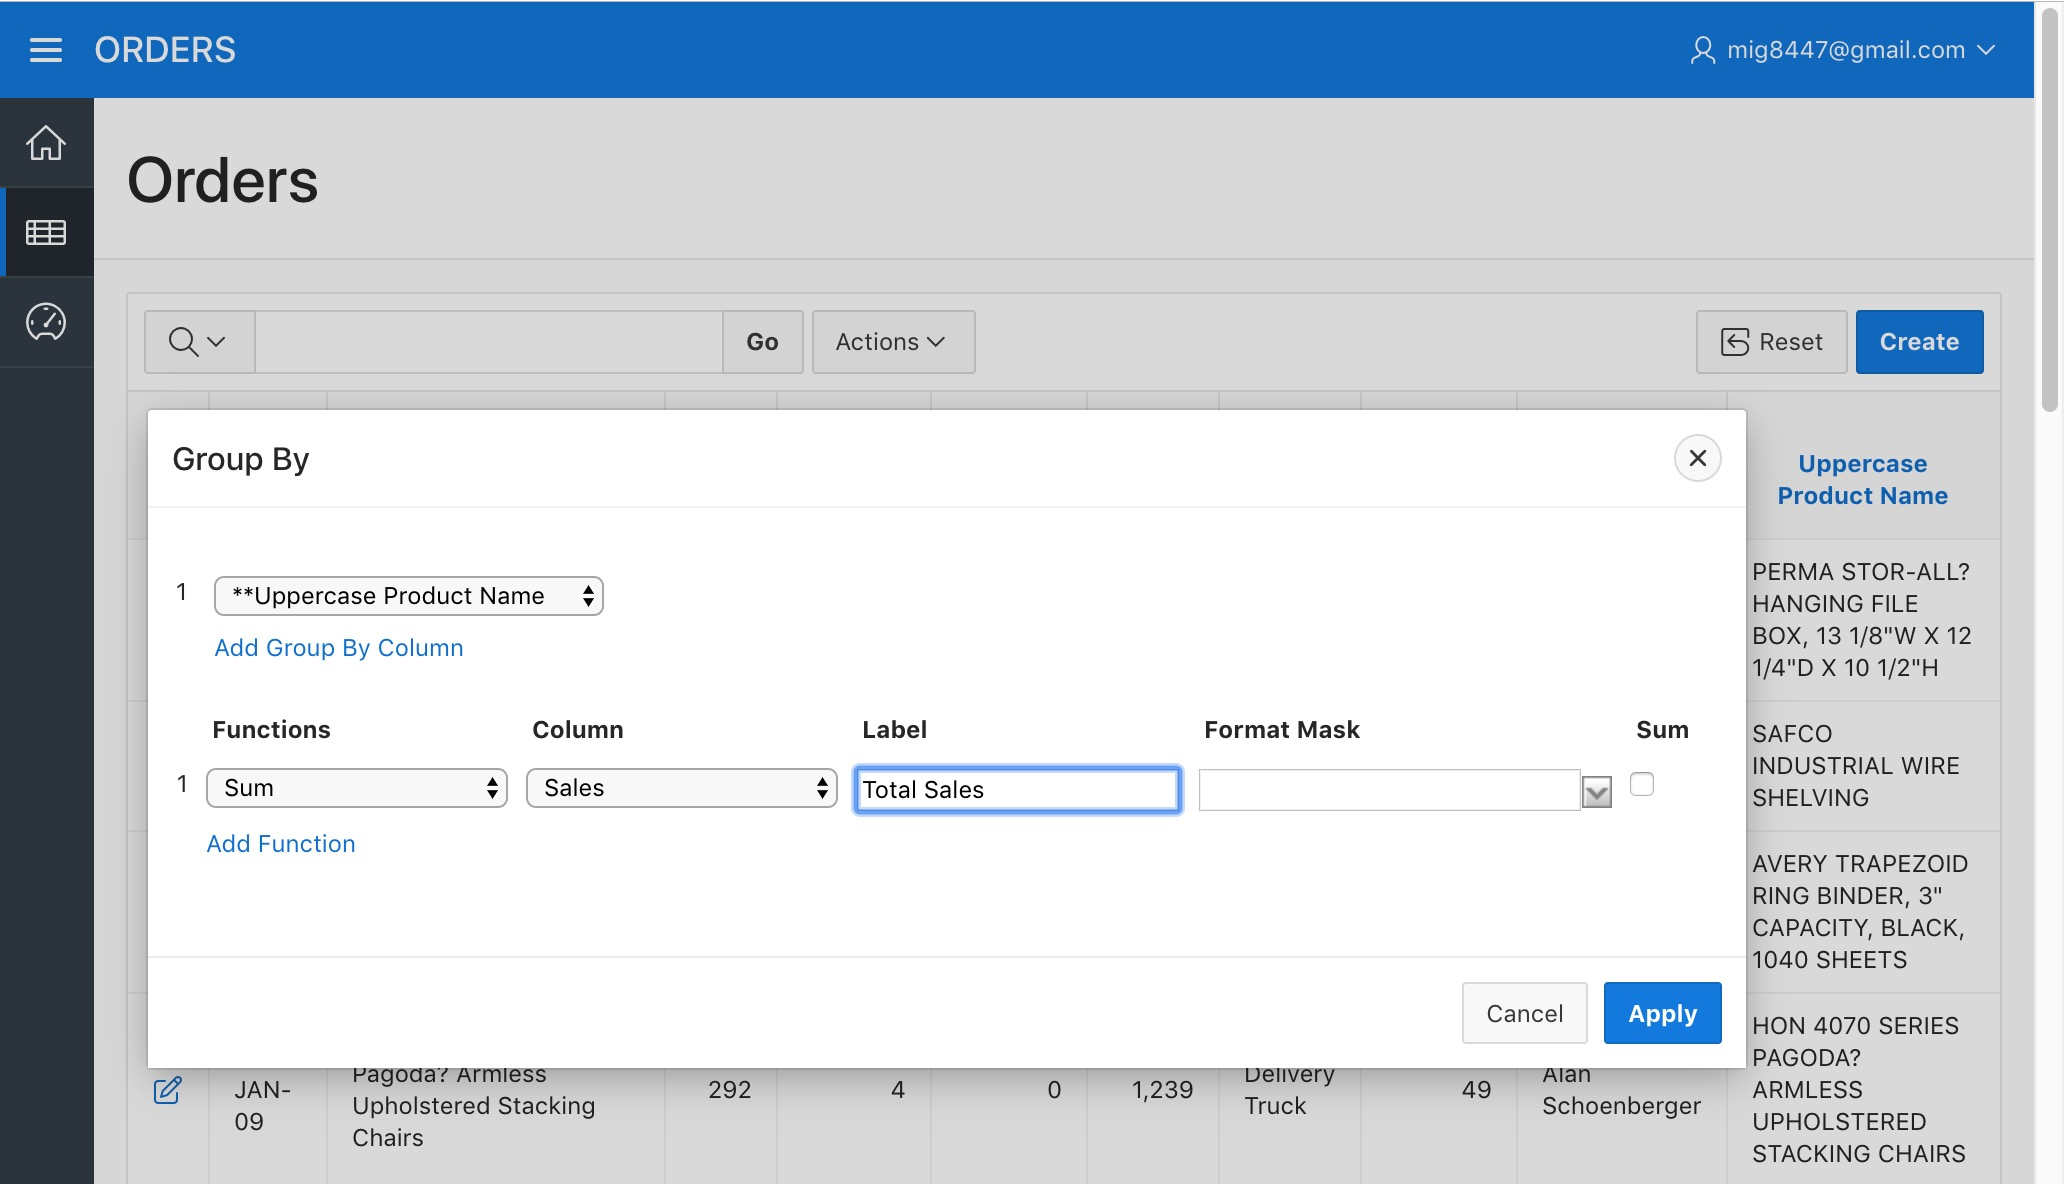
A dialog will open. Select the "**Uppercase Product Name" column (The two asterisk characters before the name mean that the selected column is a "Computed" column) as the "Group By Column", "Sum" as the "Function", "Sales" as the "Column" and type "Total Sales" as the "Label". Then click "Apply".
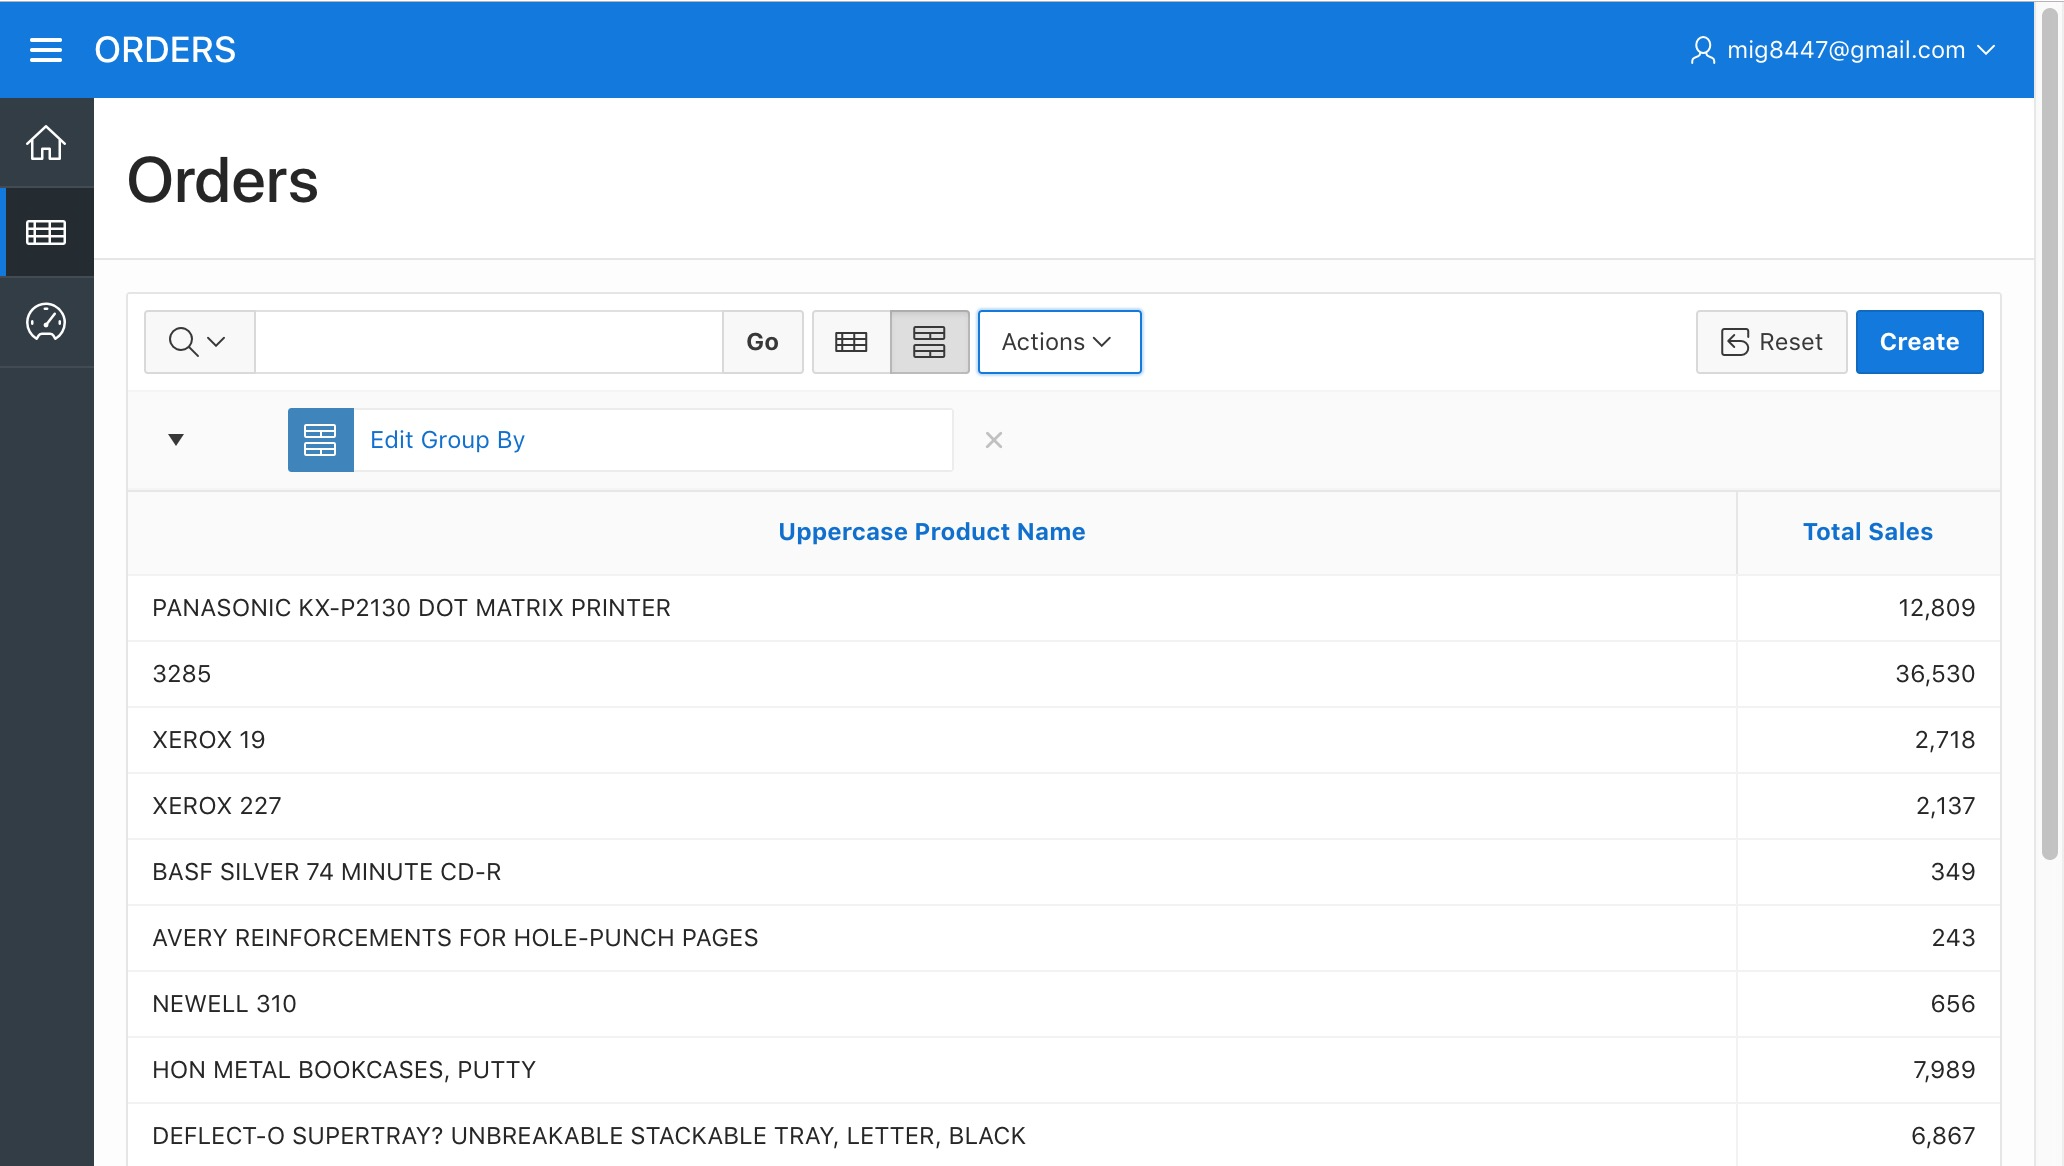
This generates a new report which has only two columns: The "Uppercase Product Name" and the "Total Sales"
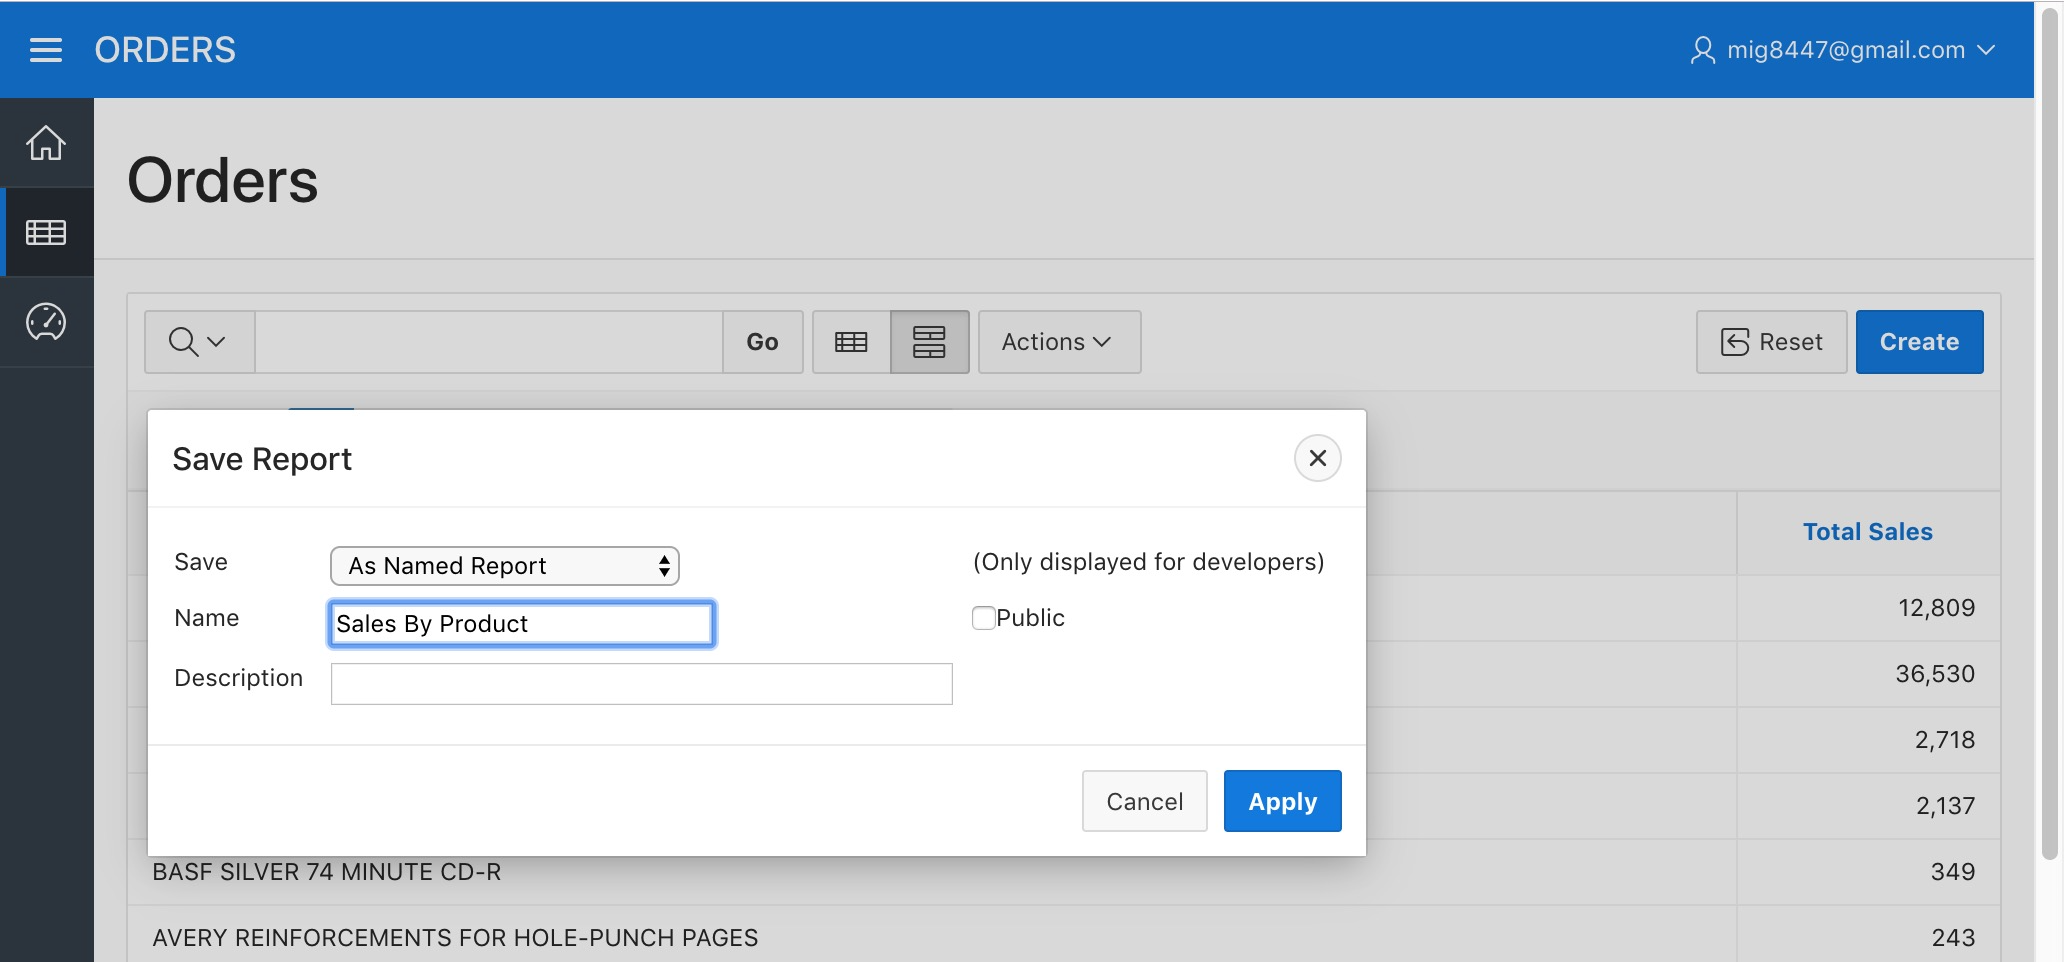
Now let's save this report to use it later. Hover the "Report" sub-menu from the "Actions" menu and select the "Save Report" option. Select "As Named Report" in the "Save" field and type "Sales By Product" as the "Name". Then click "Apply".
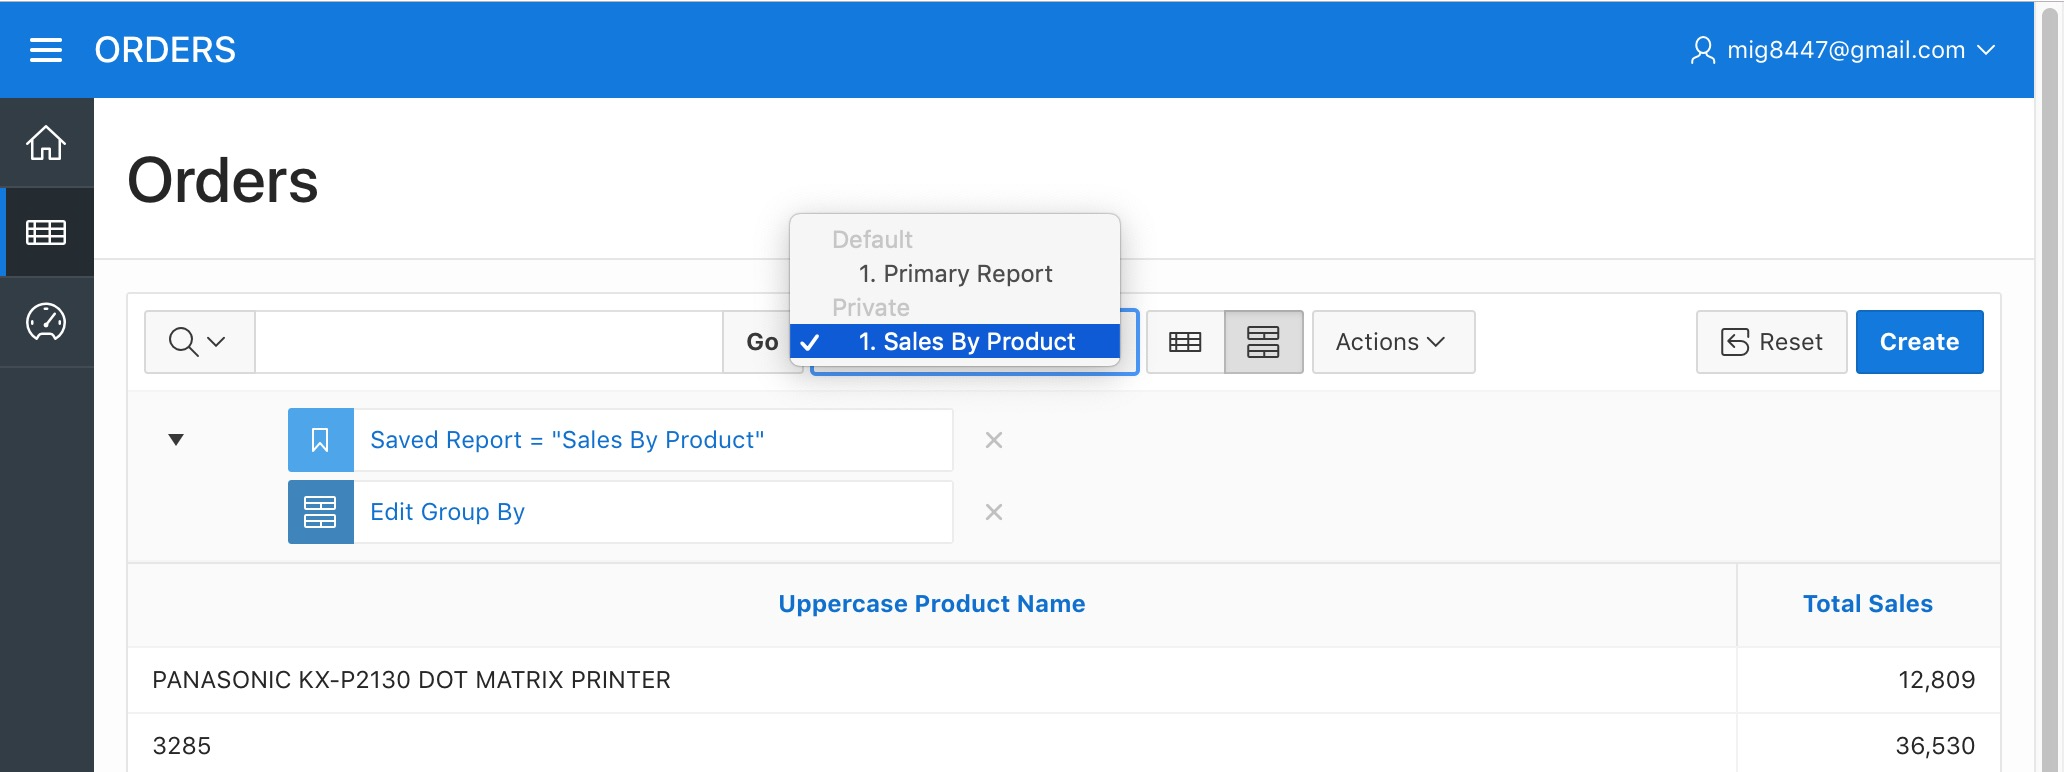
The report is now saved. You will now see a select control next to the "Actions" menu. That new control will list all the reports we've saved. Notice that the new report is listed as "Private", this means that only developers will be able to see that saved report. We'll make it public later on.
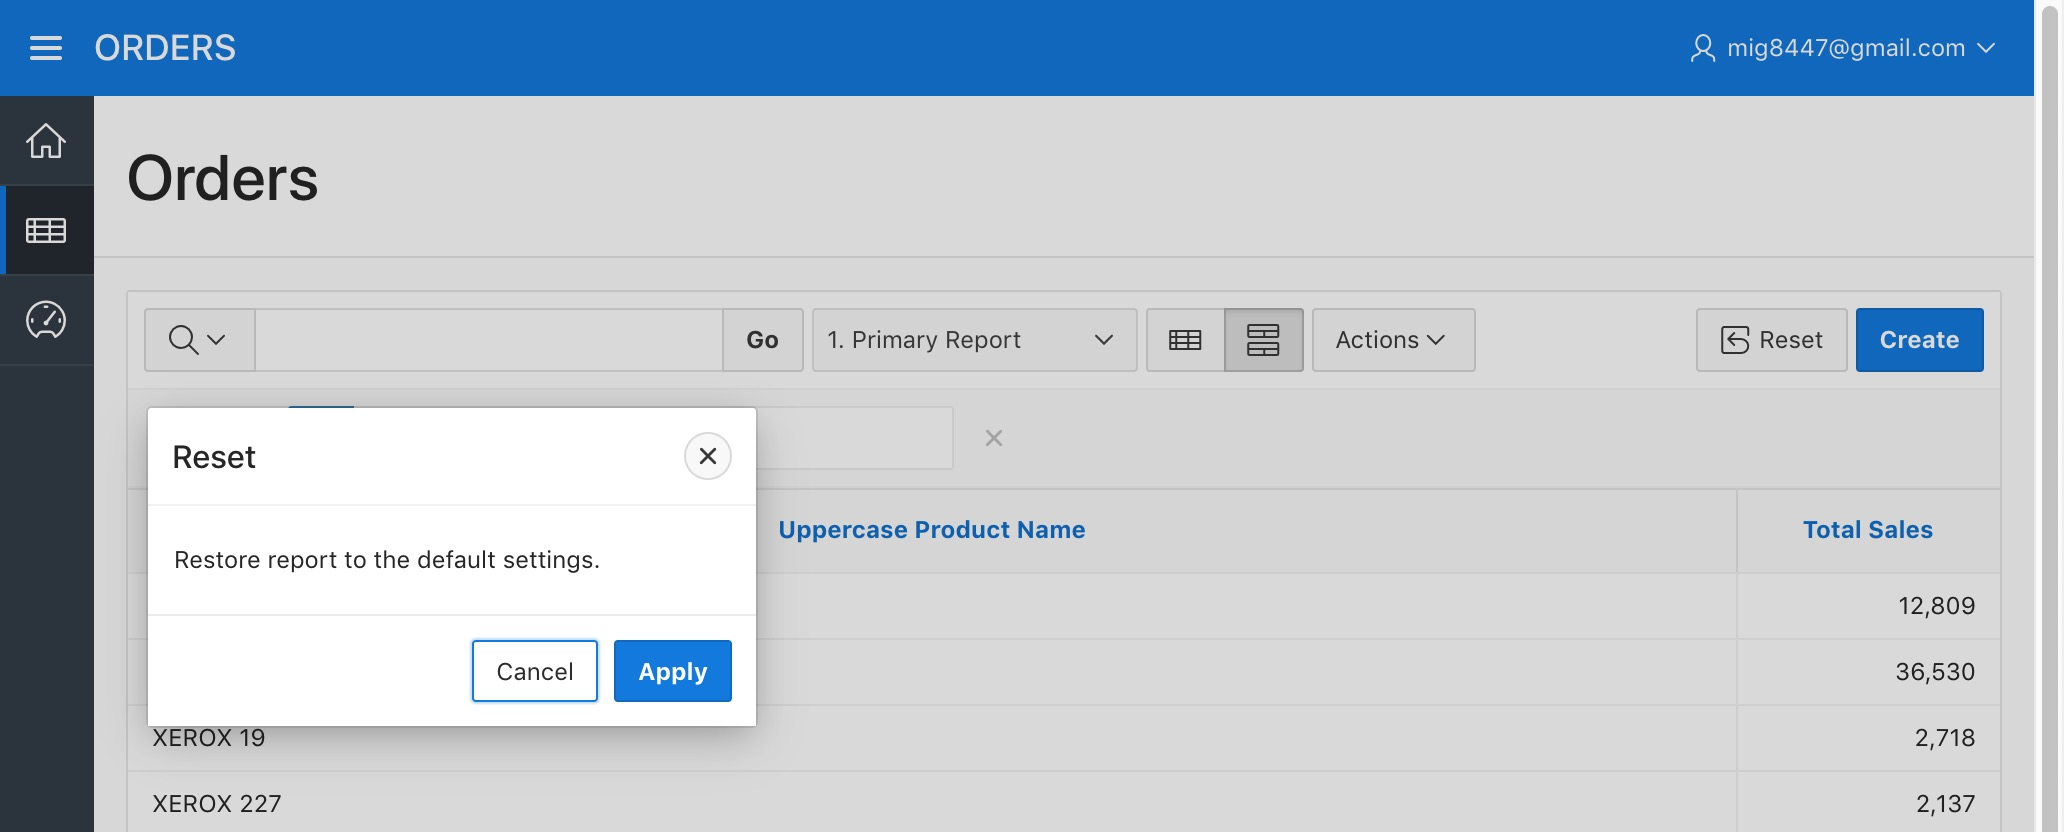
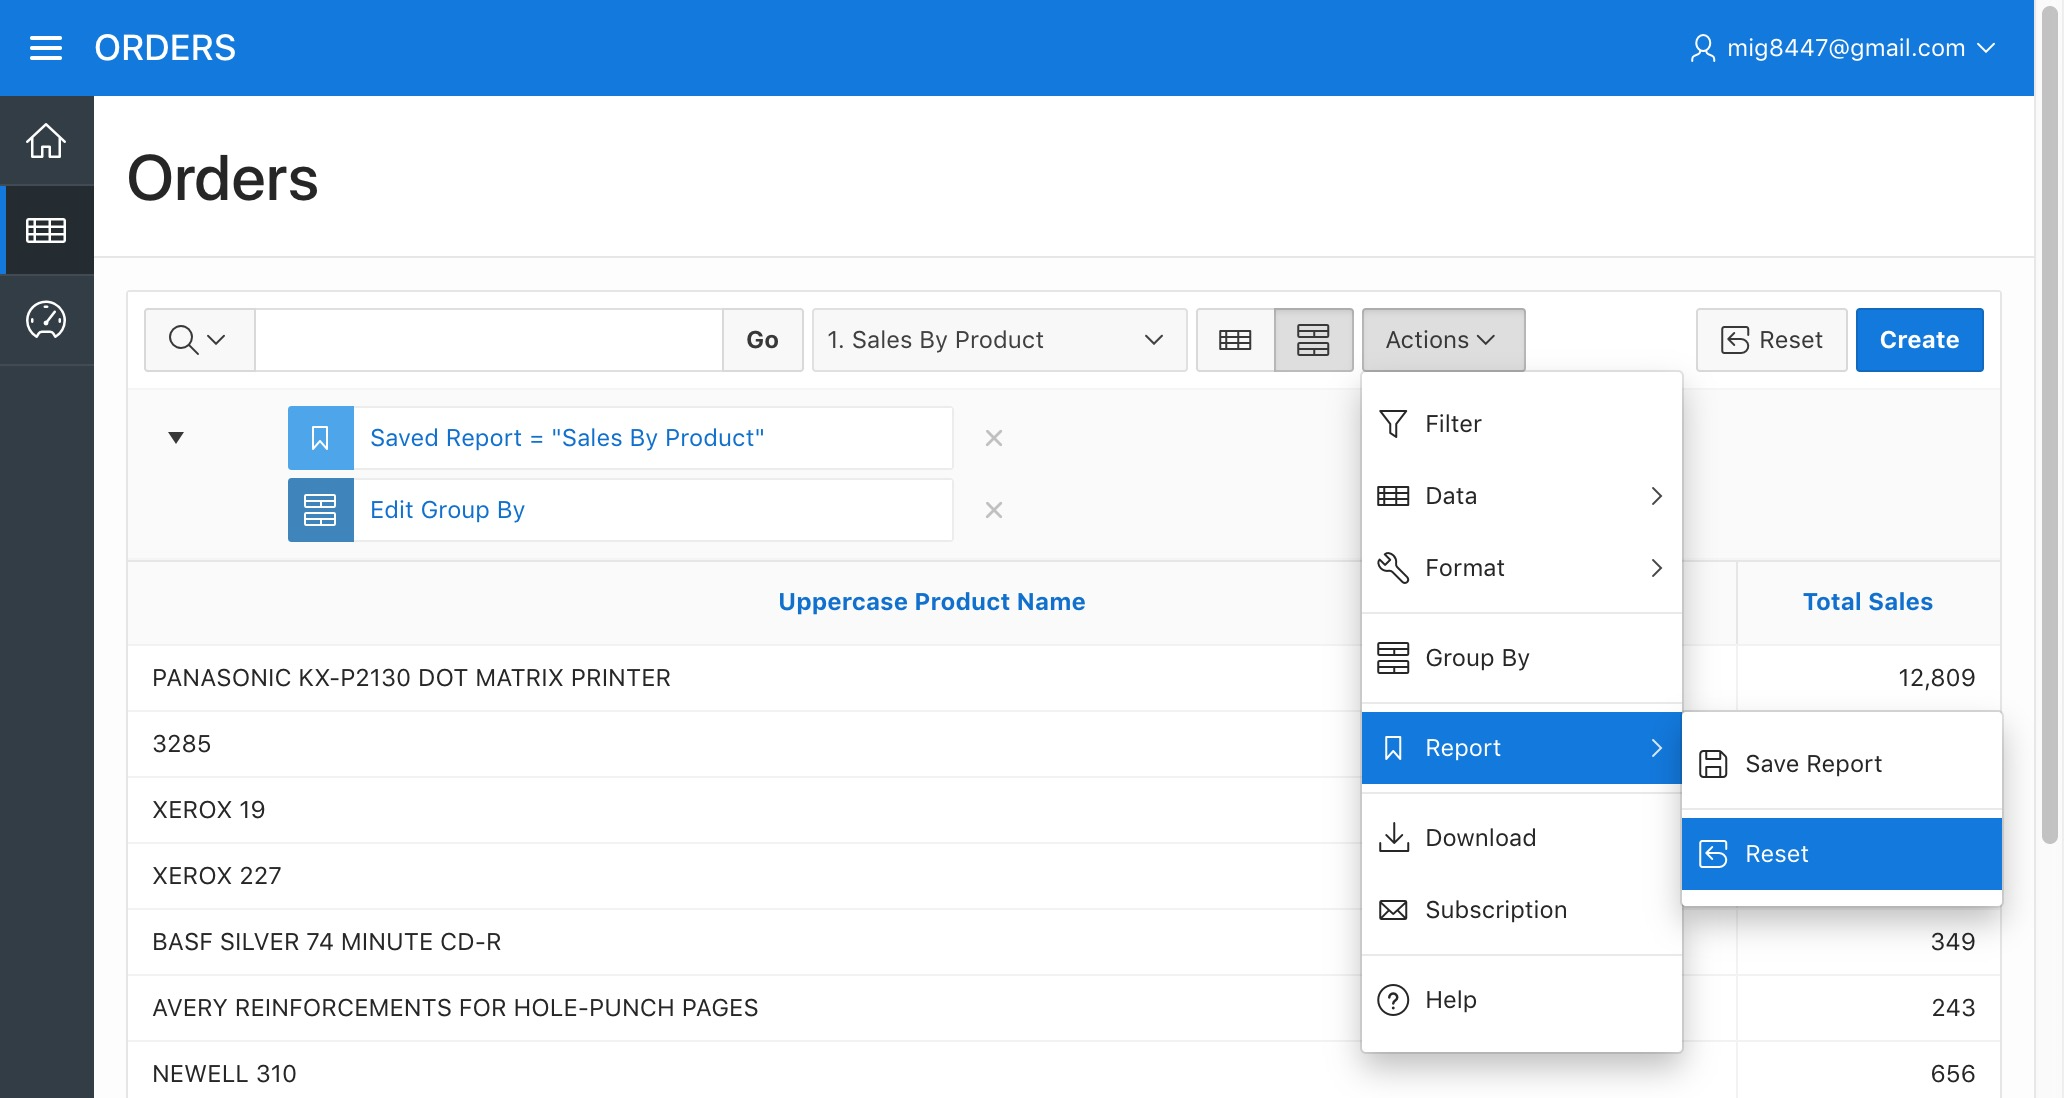
Now let's return to our "Primary Report"
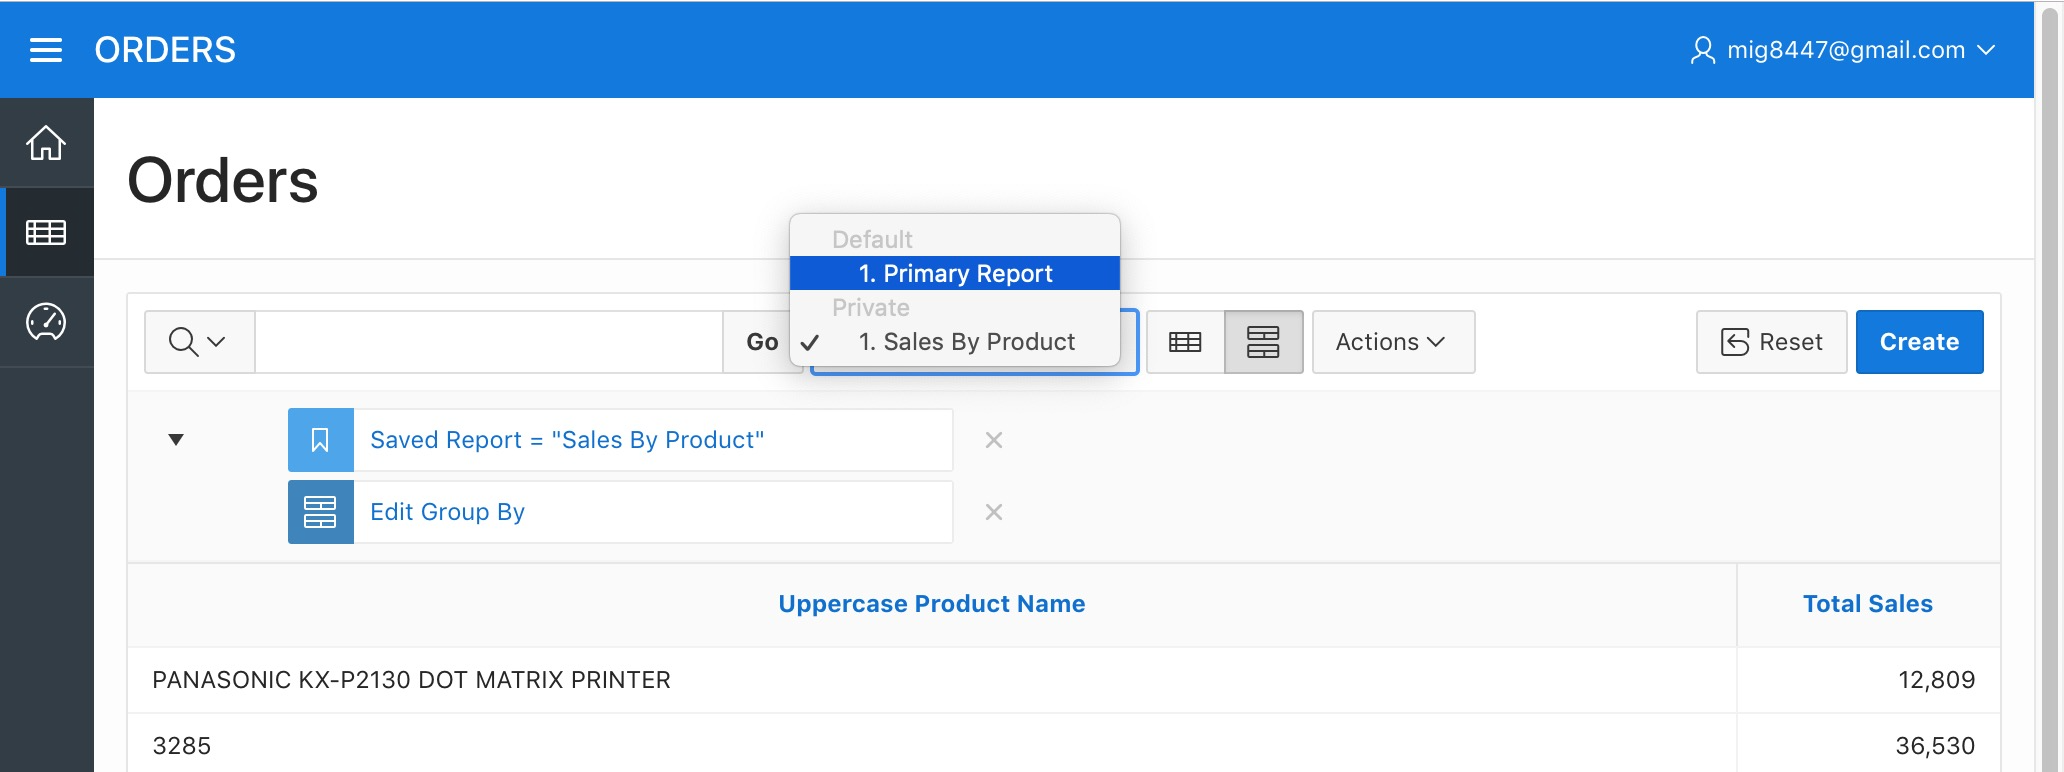
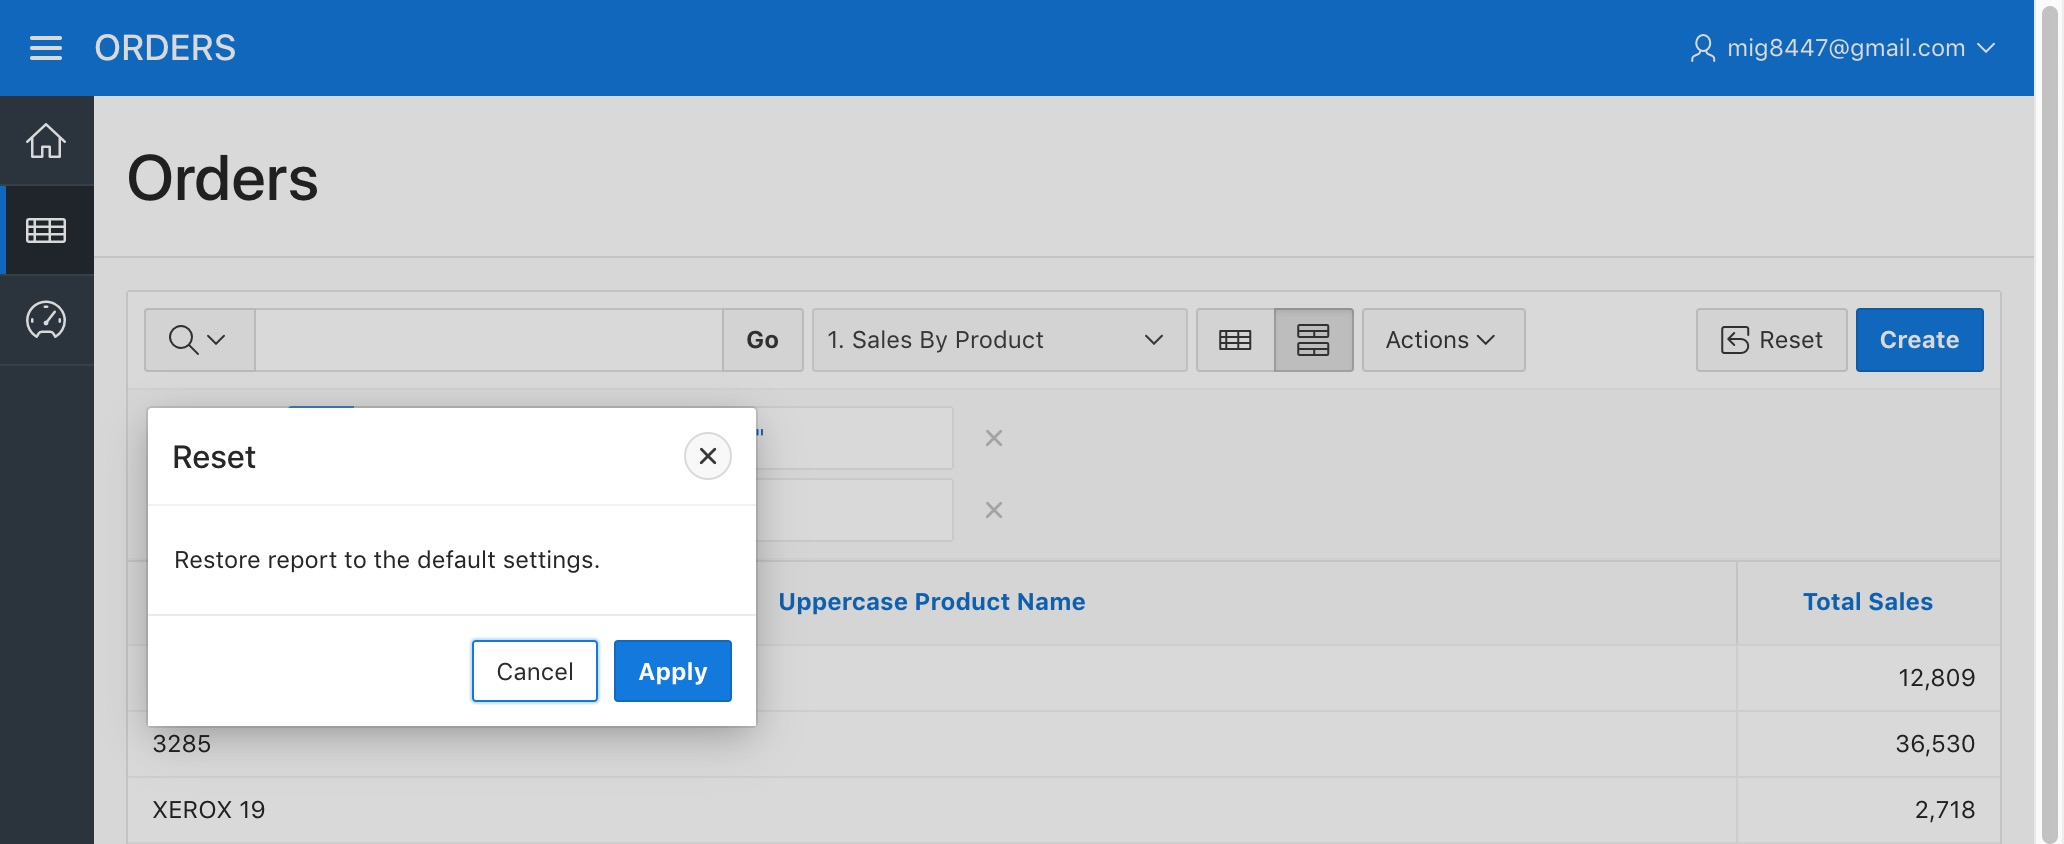
Select the "Reset" option from the sub-menu "Report" in the "Actions" menu to get it back to normal.
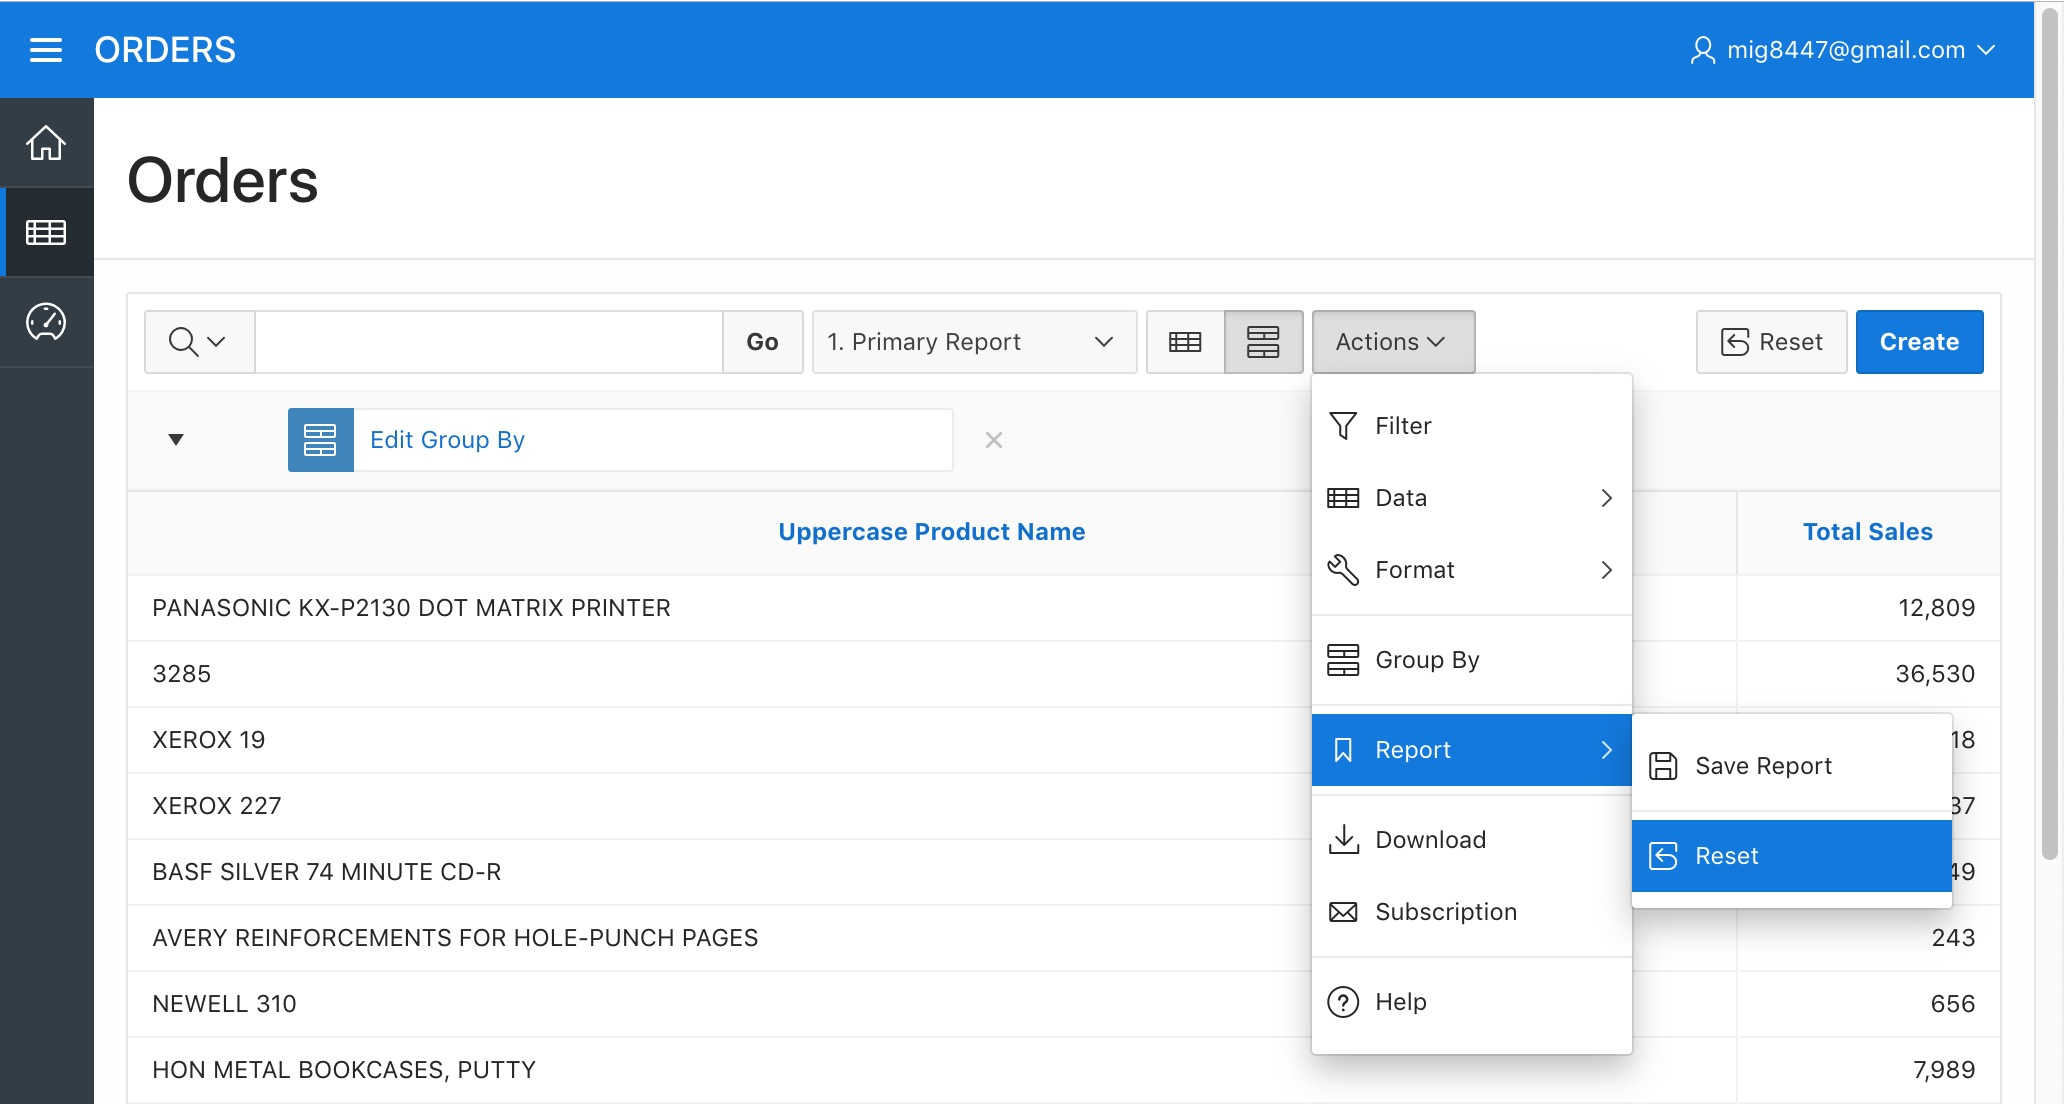
Click "Apply" on the dialog that appears. And it will get back to the saved report.
We'll now create another computed column for the year of the sale.
Data Computations - Obtaining the Full Year from a Date
Click on the "Actions" menu once more and select the "Compute" option from the "Data" submenu. Type "Order Year" as the "Column Heading" and get the following on the "Computation Expression"
TO_CHAR( B, 'YYYY' )
Once more, make sure the letter B corresponds to the "Order Date" in the "Columns" list and if not, please change it for the corresponding letter in the "Computation Expression".

Click "Apply". A new column called "Order Year" now appears on the screen
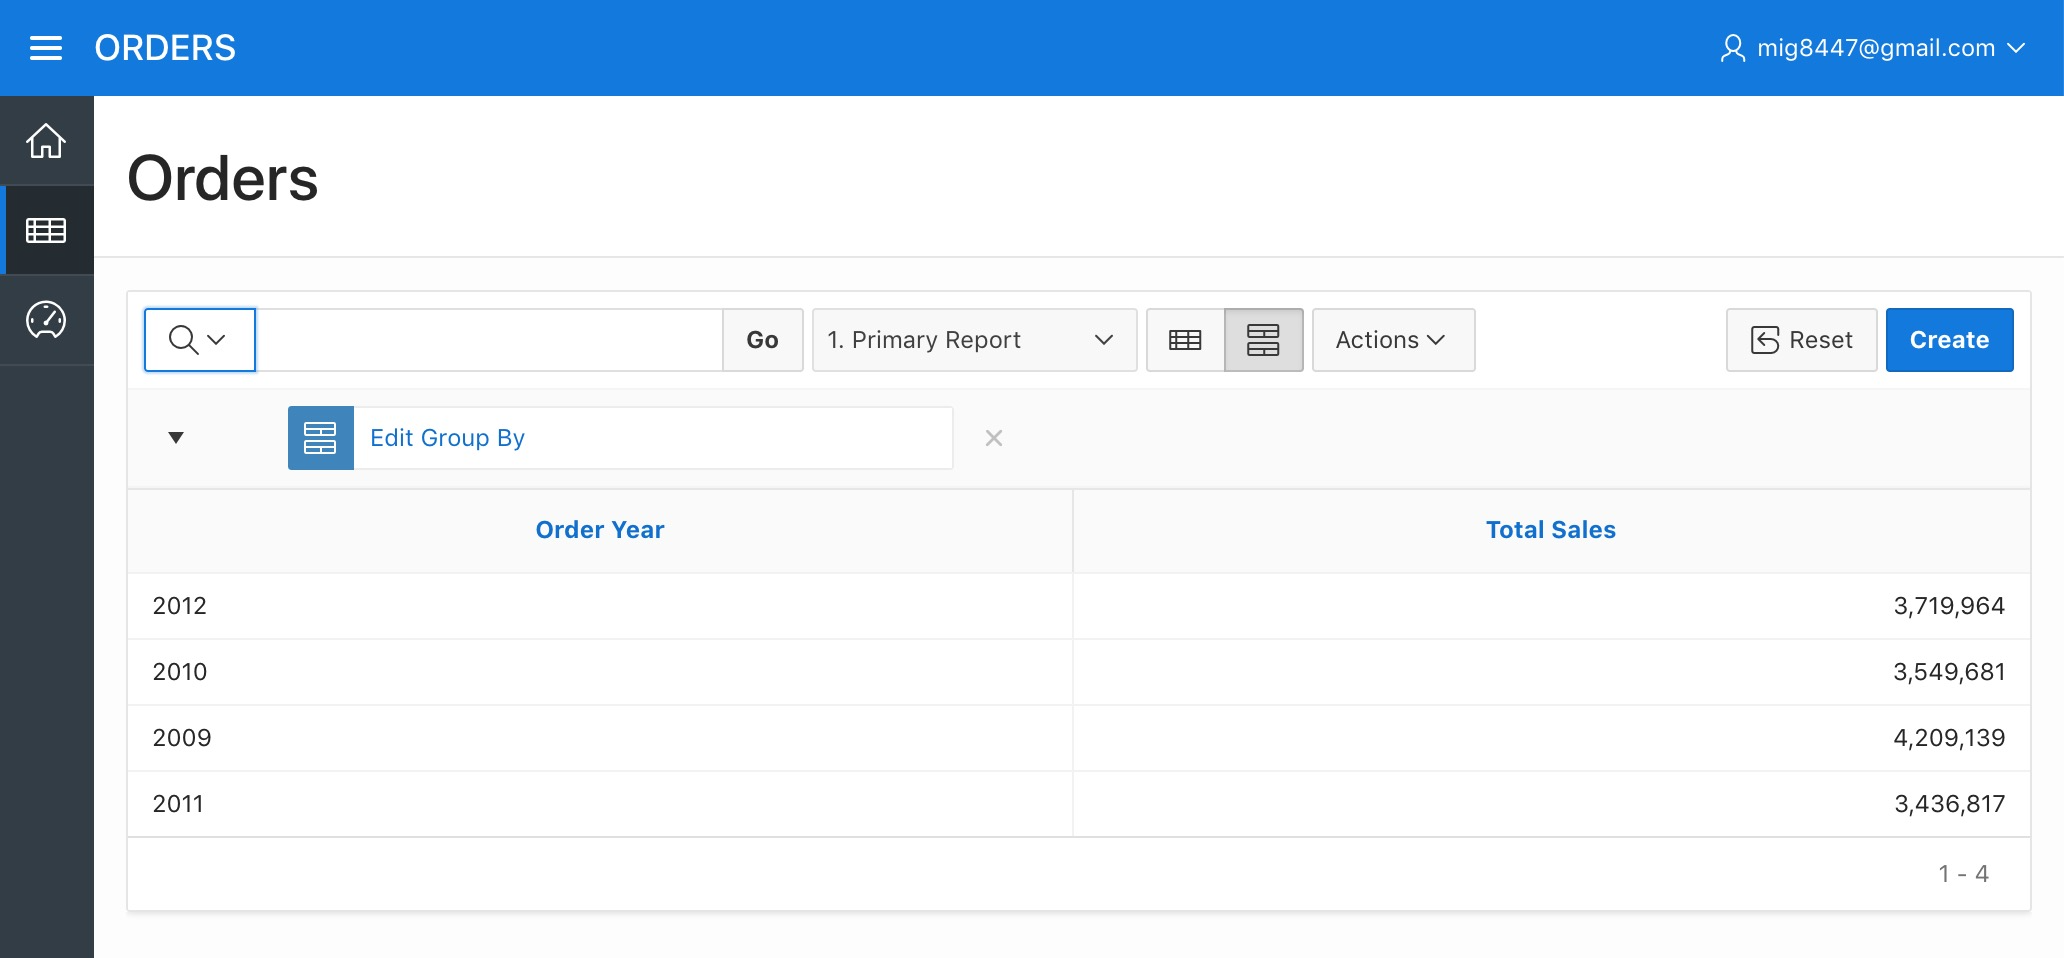
Grouping Data - Creating a "Sales By Year" Report
Back to the report, lets create a new "Group By" by selecting such option from the "Actions" menu. Select "**Order Year" as the "Group By Column", "Sum" as the "Function", "Sales" as the "Column", and "Total Sales" as the "Label".
Click "Apply". We now have a "Sales by Year" report.
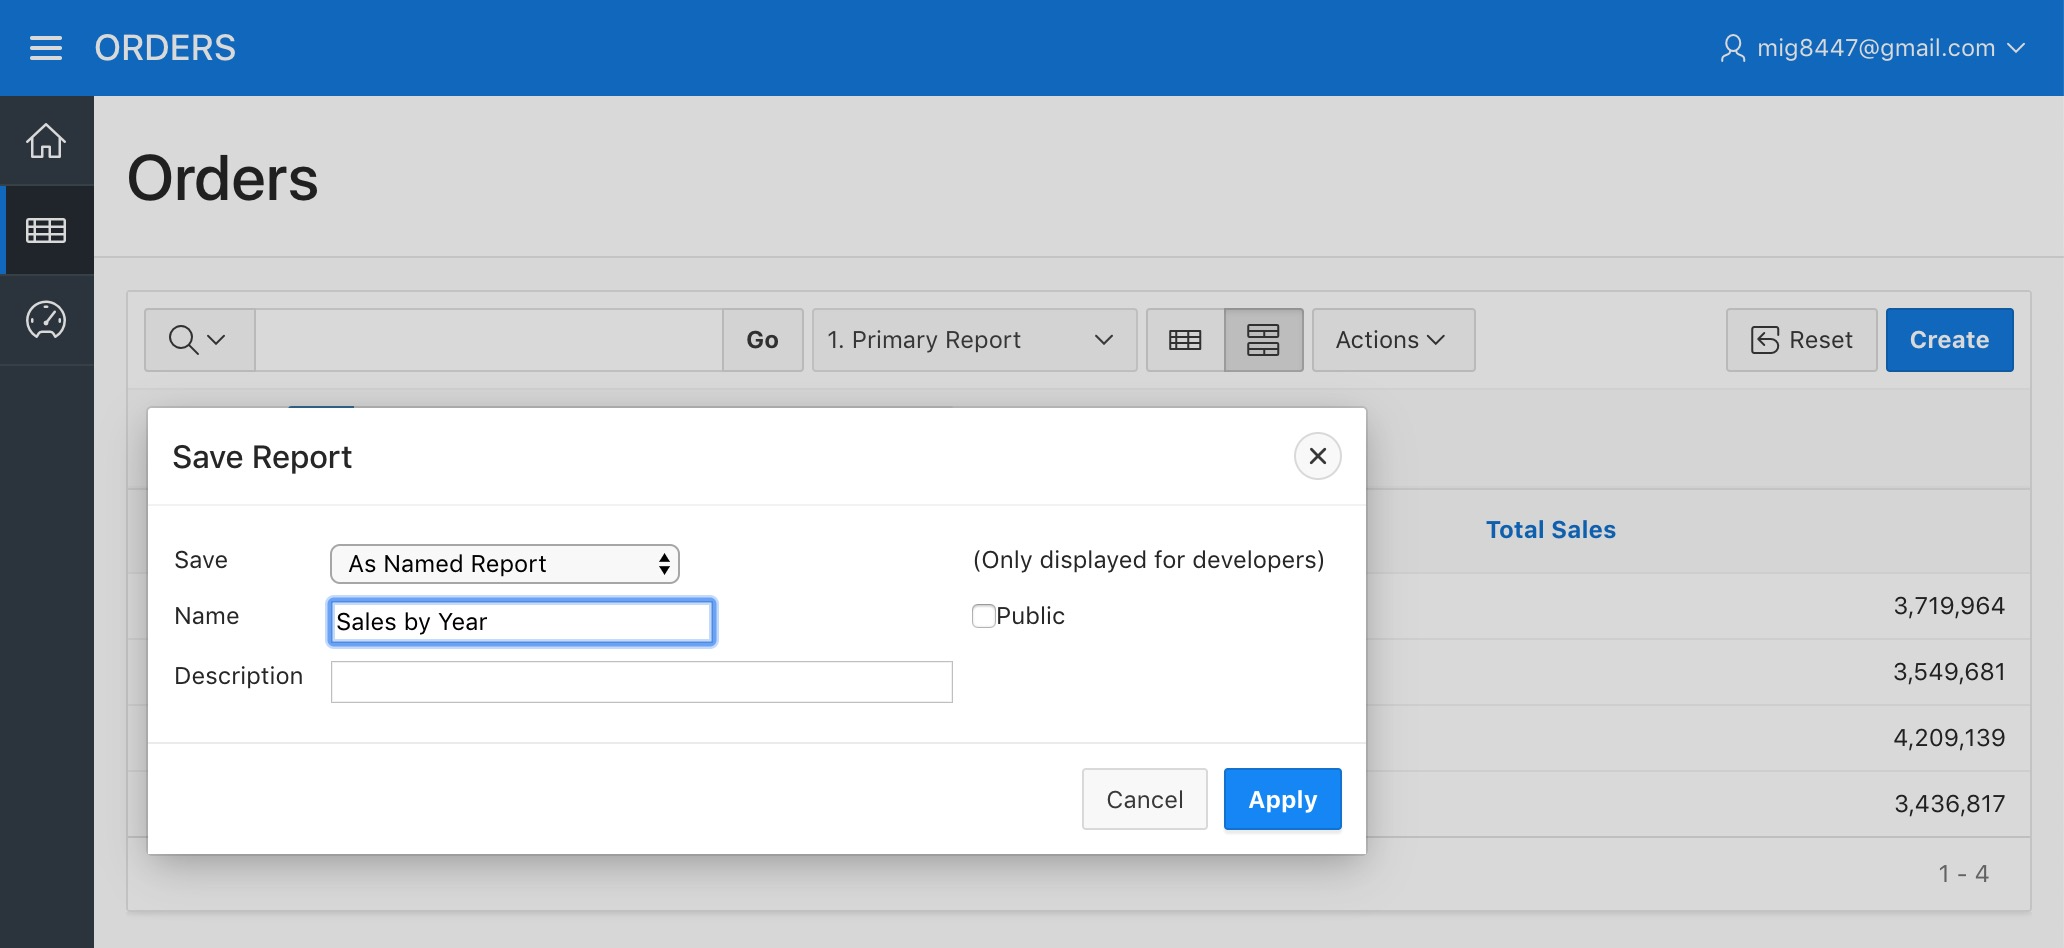
Let's save it as a "Named Report". Name it "Sales by Year". Then click "Apply"
Now lets get a chart from the displayed data.
Charting Data - Creating a "Sales By Year" Chart
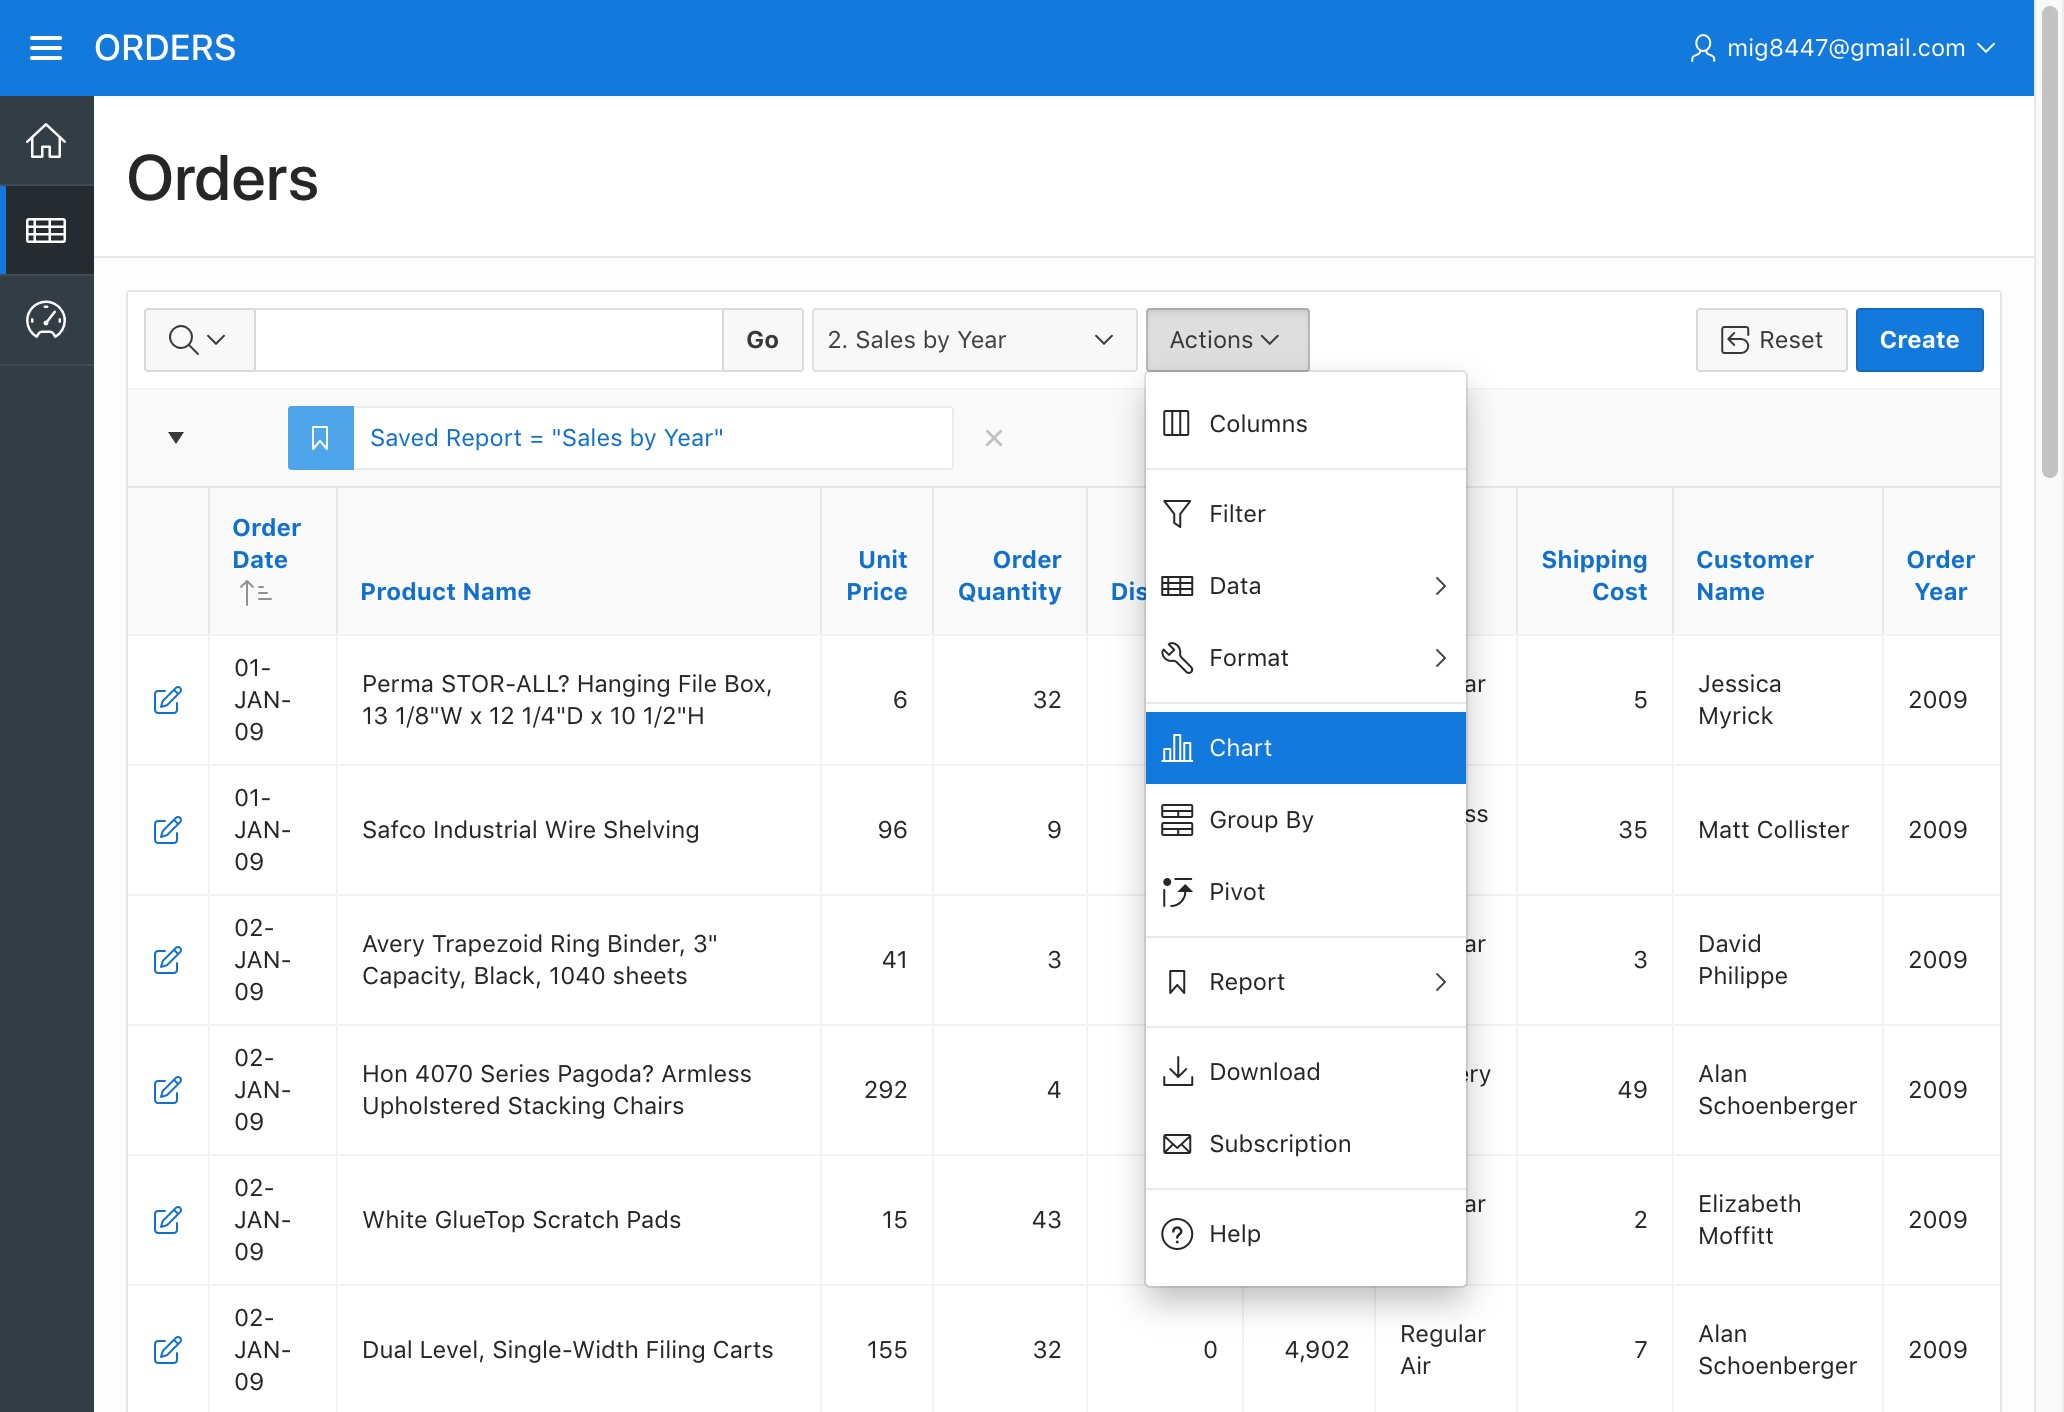
Click on the "X" button next to the "Edit Group By" element just below the search bar.

Select the "Chart" option from the "Actions" menu
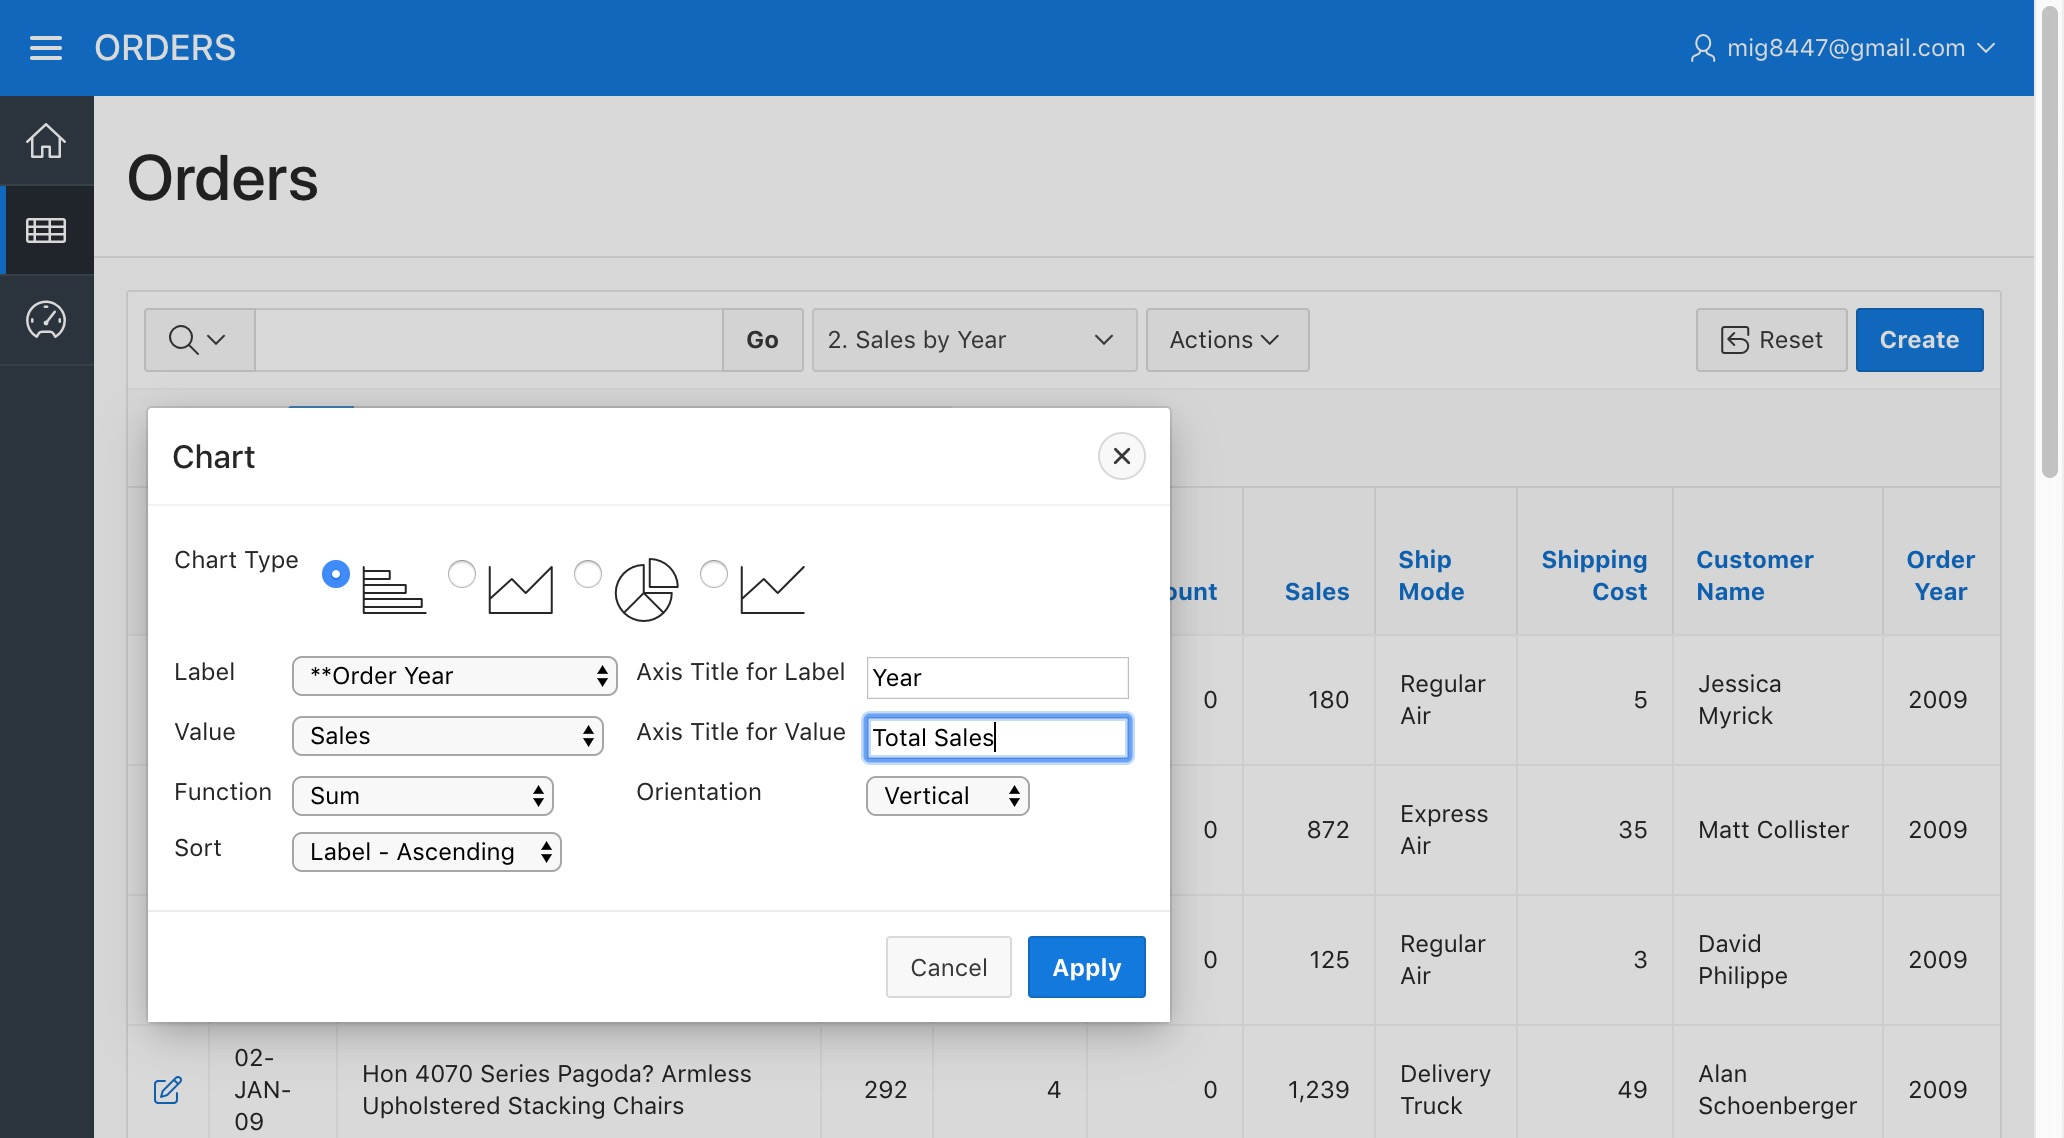
Now pick "**Order Year" as the "Label", "Sales" as "Value", "Sum" as the "Function", "Label - Ascending" as the "Sort", "Year" as the "Axis Title for Label", "Total Sales" as the "Axis Title for Value" and "Vertical" as the "Orientation". Click "Apply"
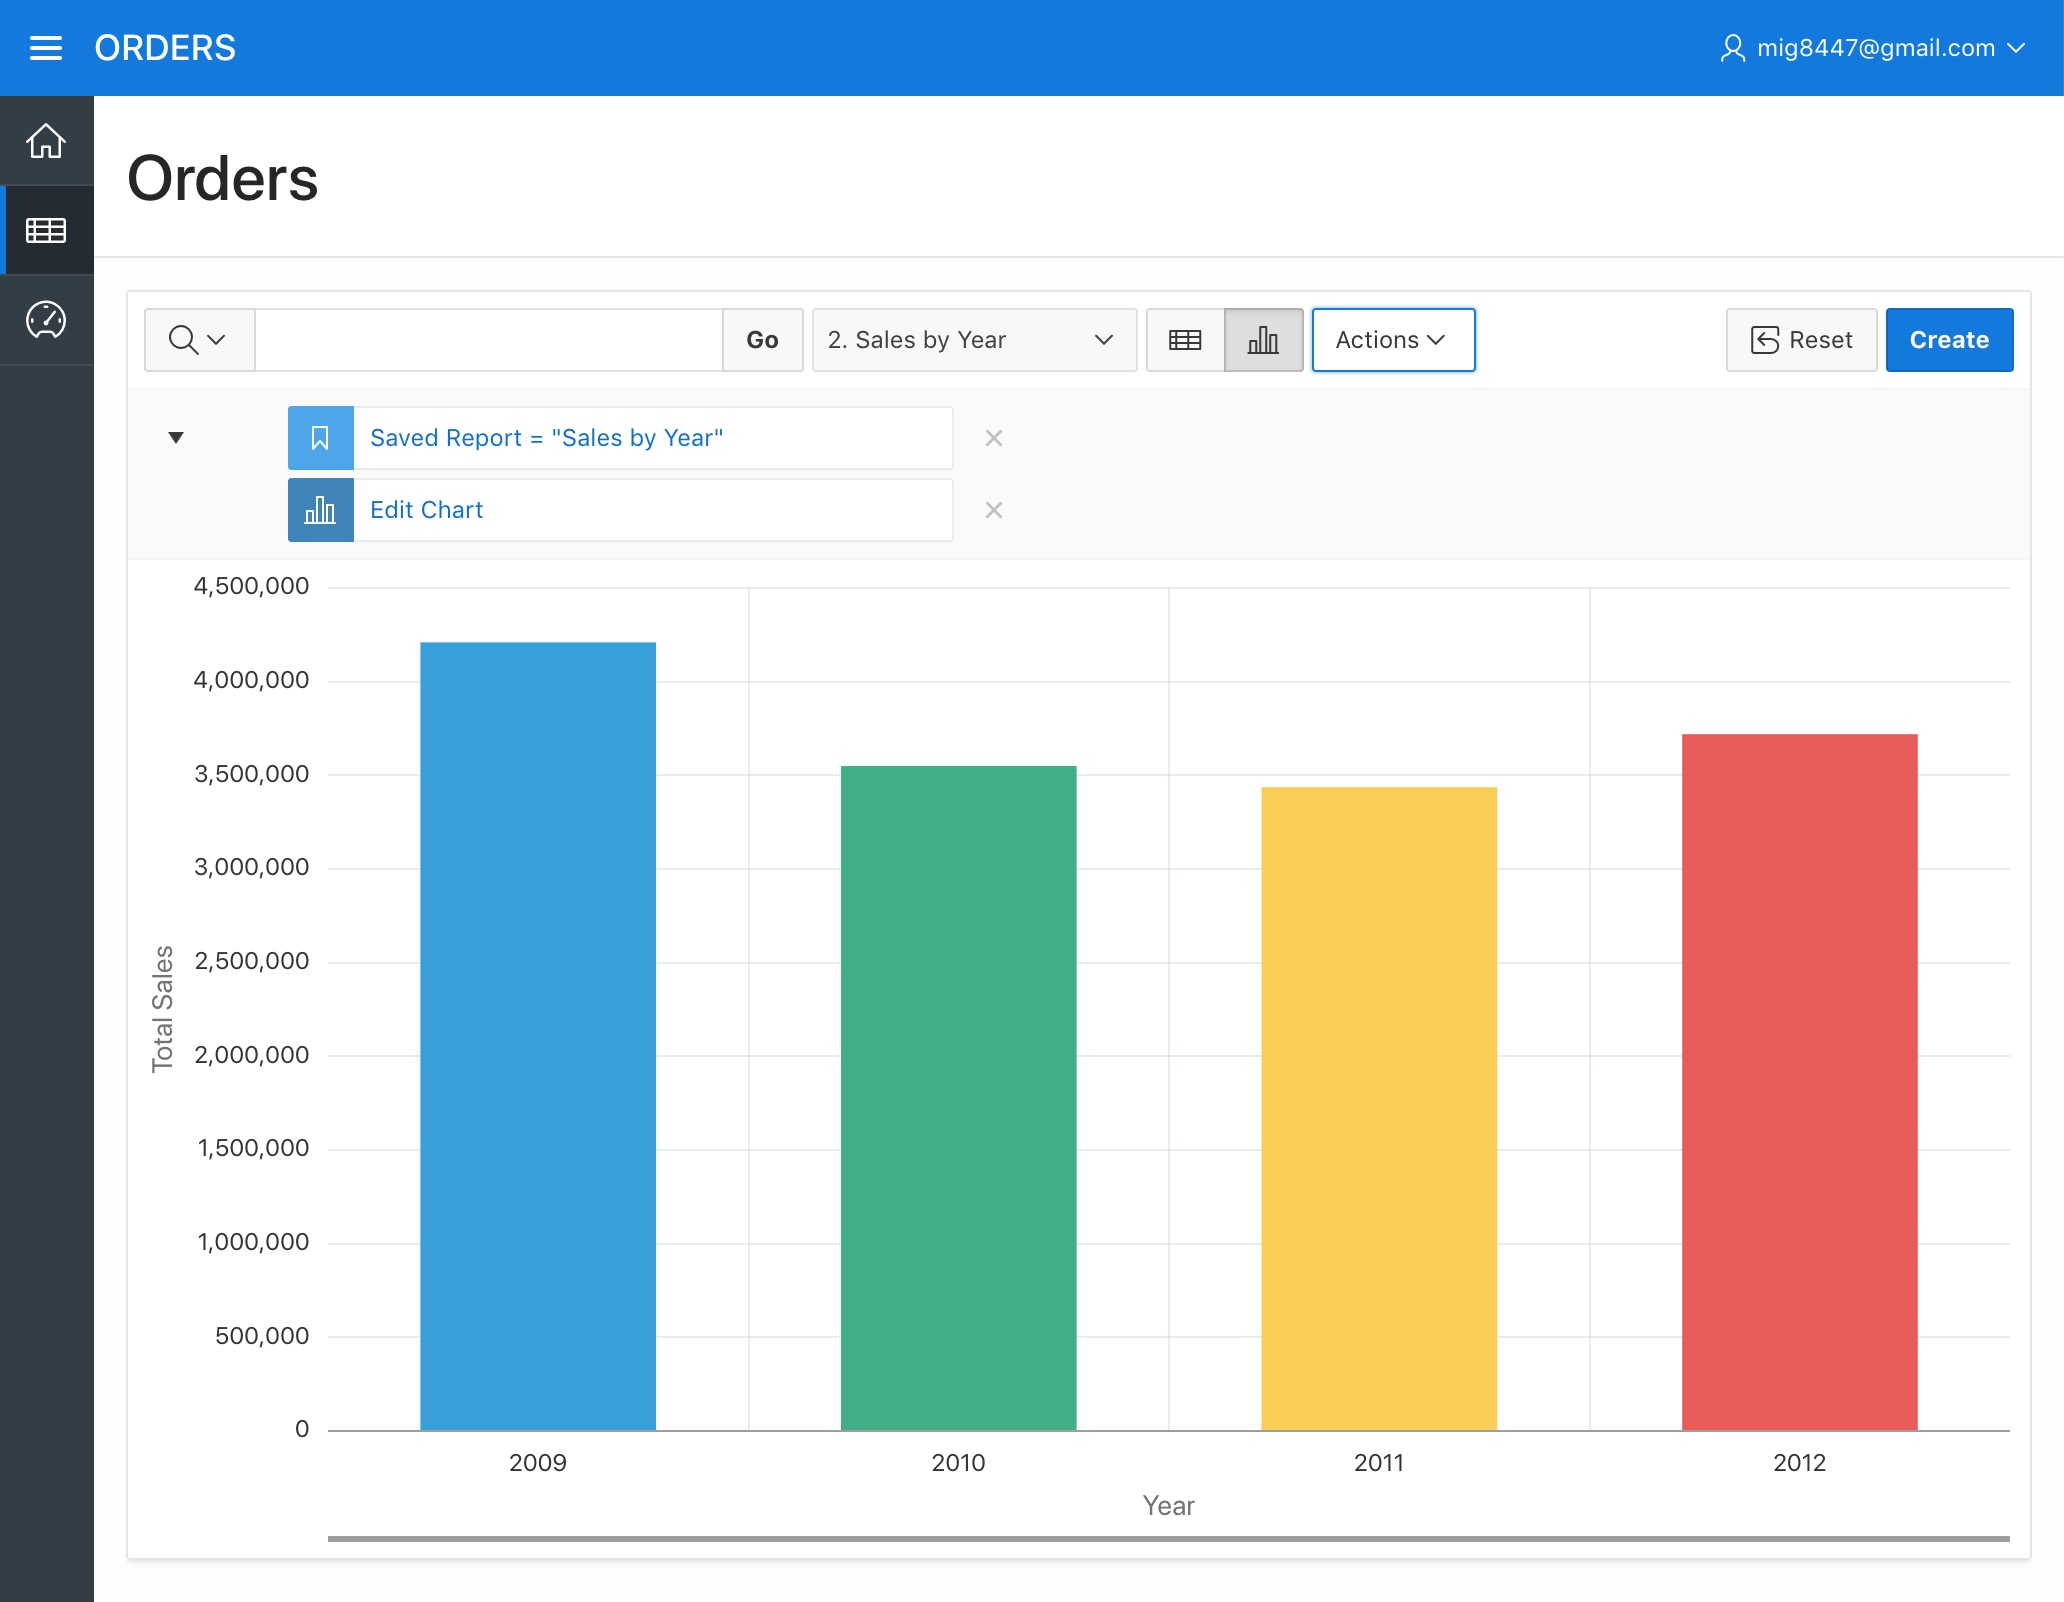
You now have a chart of "Sales by Year".
Save it as a named report and give it the name "Sales by Year (Chart)". Then click "Apply".
Named vs Default reports
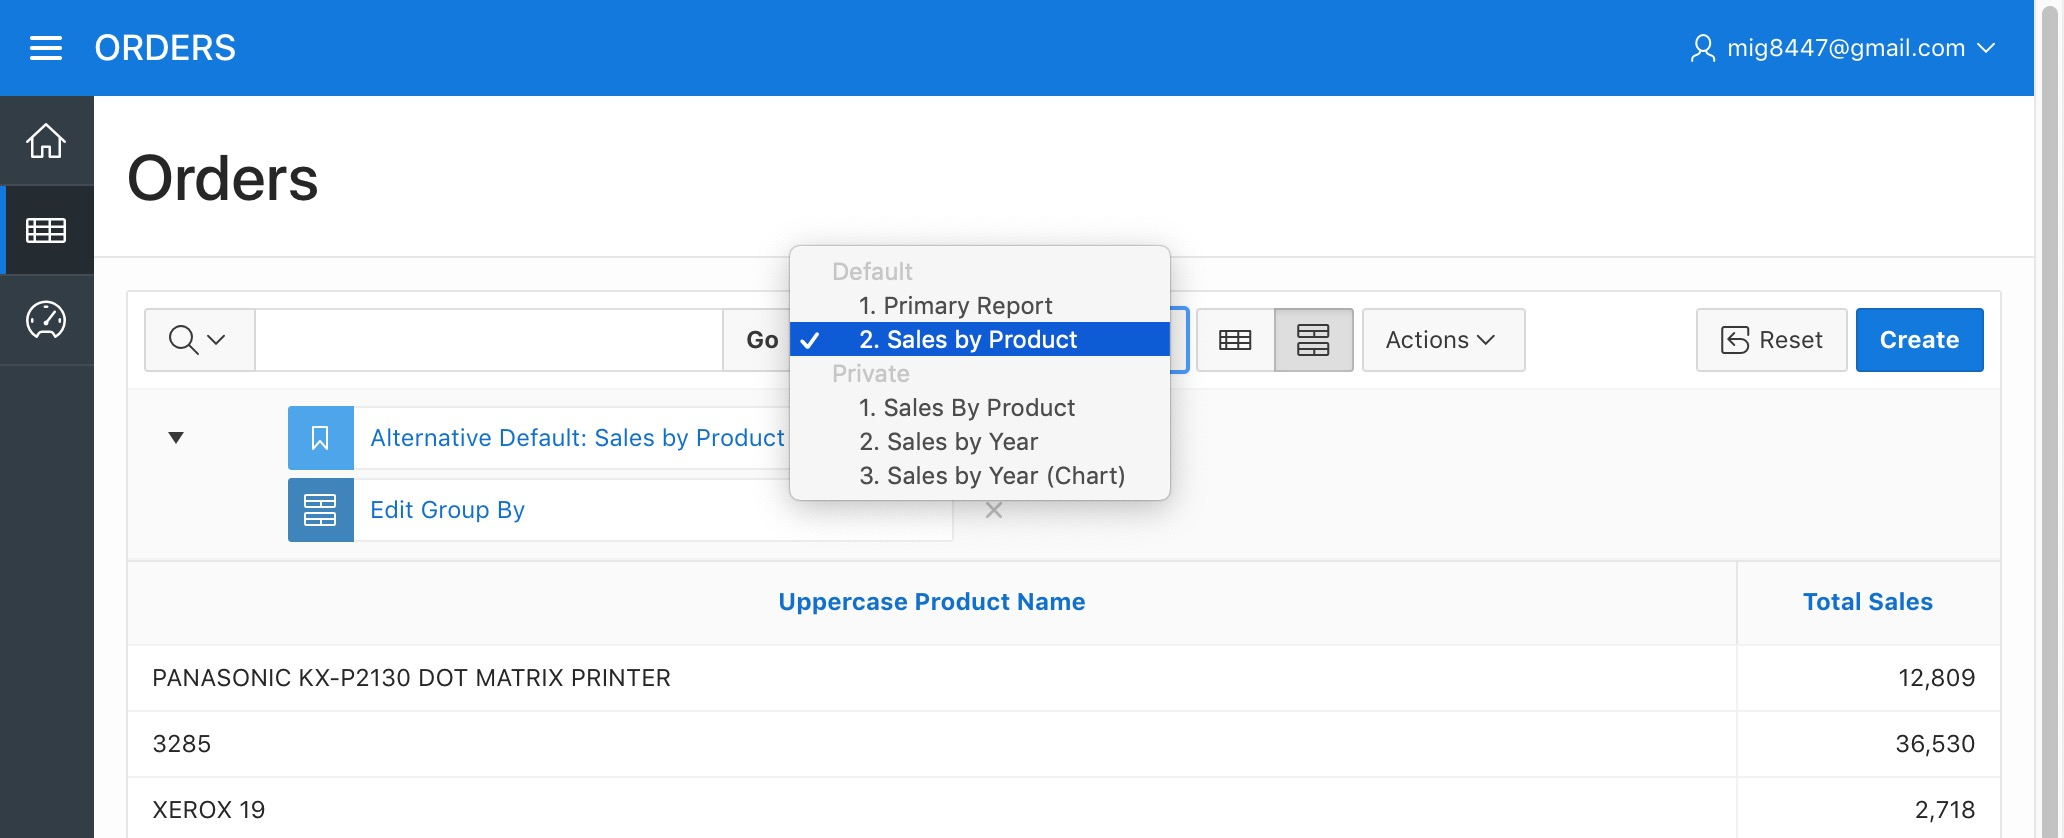
Notice you now have three Private reports. Private reports are only visible by their developer. This can be useful when creating or modifying a report without modifying the user's report list. Now that our reports are ready, let's make them available for the users. Select a report from the list next to the search bar.
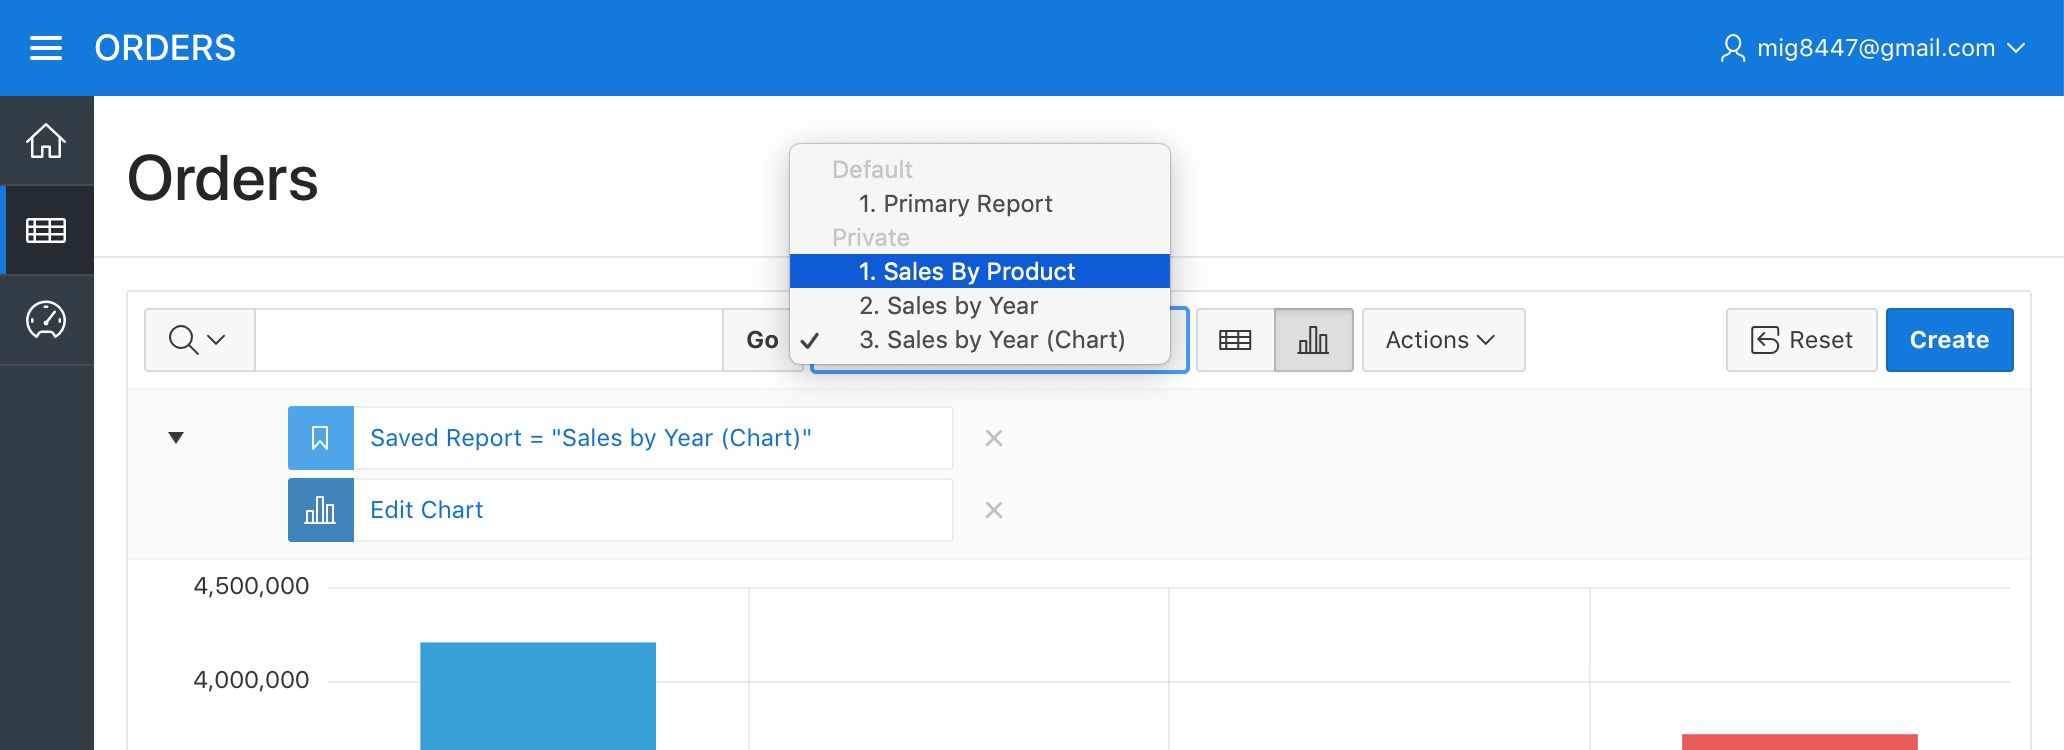
Select the "Reset" option from the "Report" sub-menu under the "Actions" menu. This will get the report back to its saved state.
Confirm by clicking "Apply"
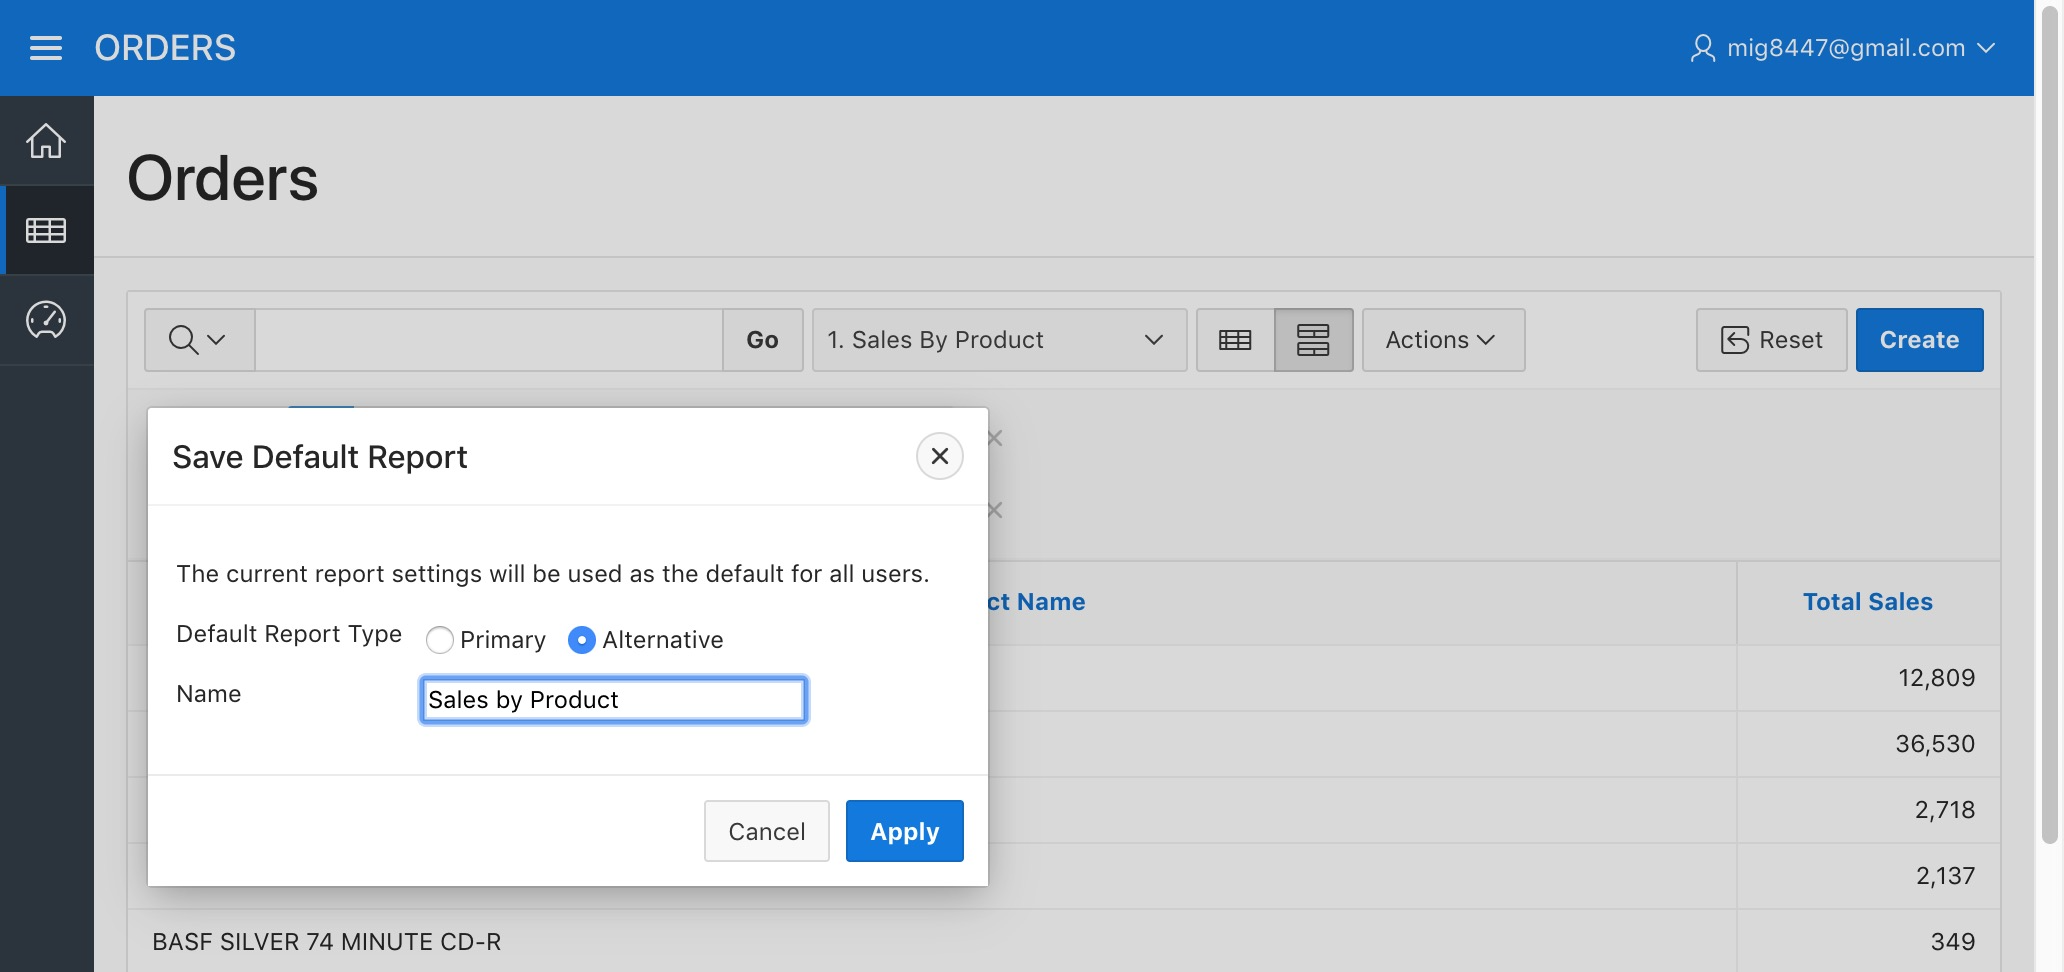
Click on the "Save Report" option from the "Report" sub-menu. Now, instead of saving it "As Named Report" we will save it "As Default Report Settings", this will make the report visible to the application users.
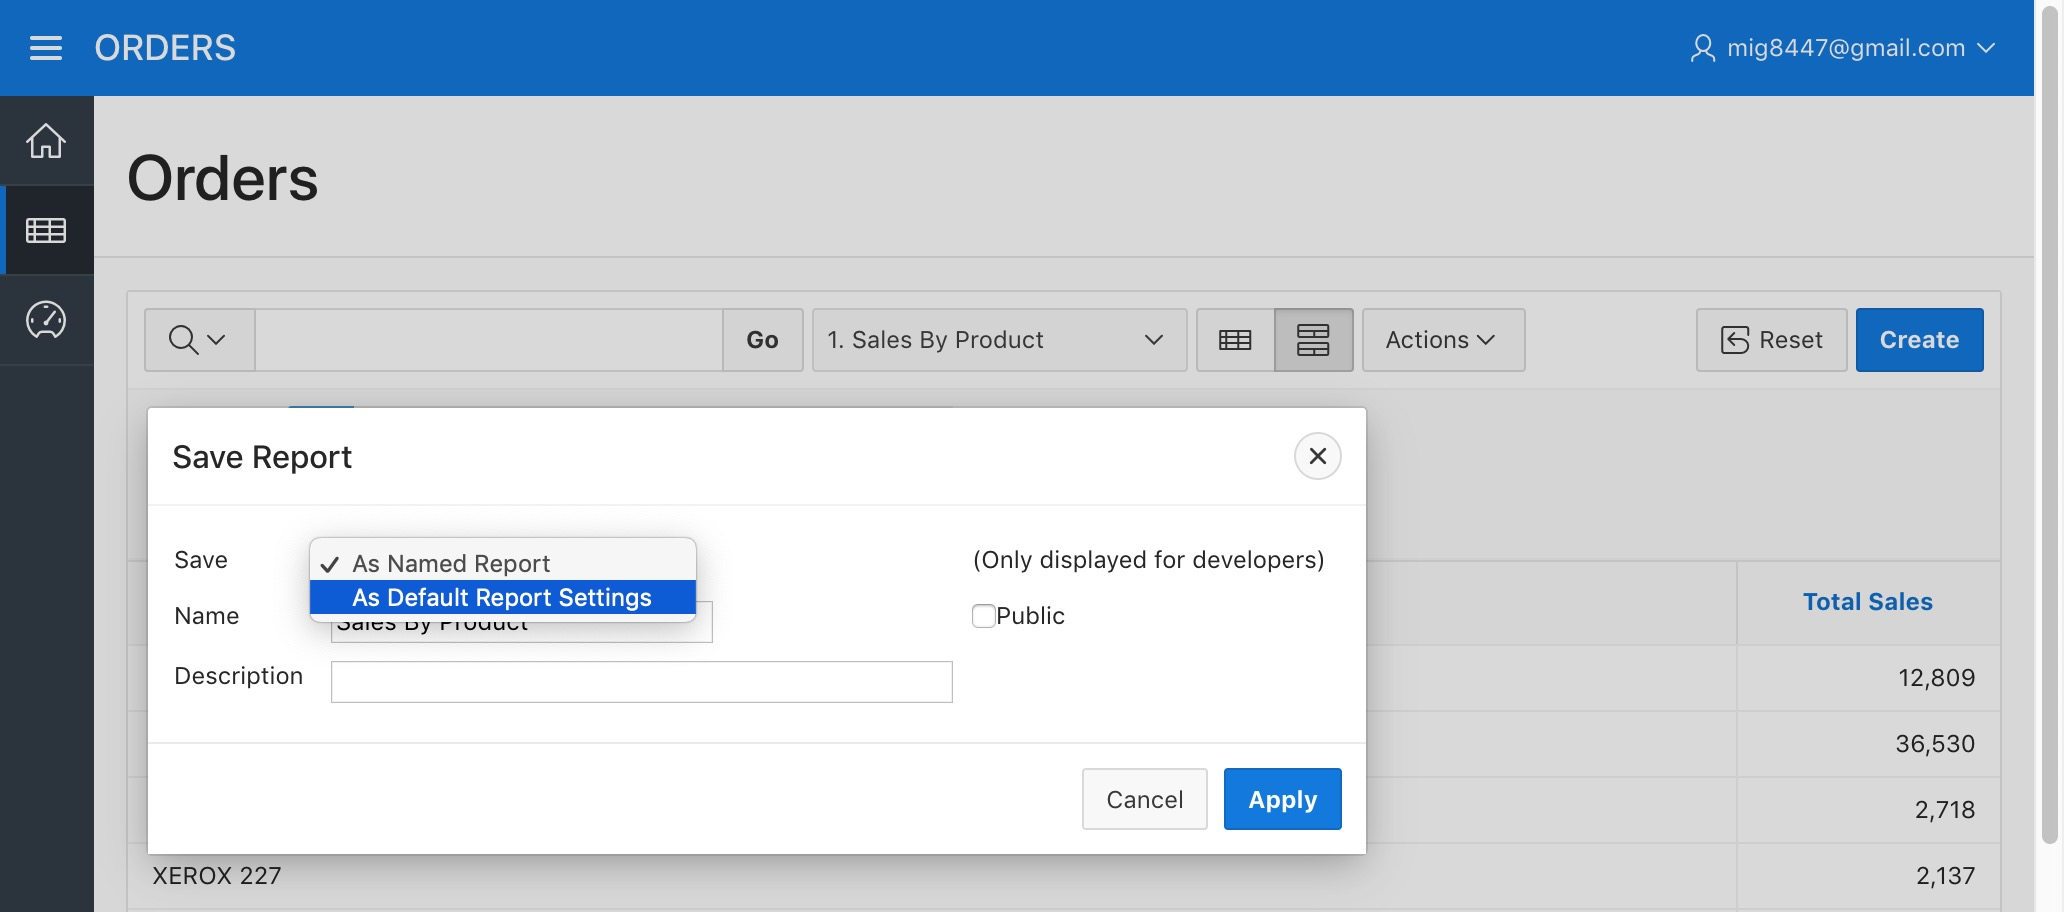
Once the above dialog appears, select "Alternative" as the "Default Report Type" and enter the corresponding report name as the "Name", then click "Apply".
Once saved, the report will appear under the "Default" category in the reports list next to the search bar and will be visible by the application users.
As a final note, it is worth mentioning that the application users can also make use of the report features depicted in this document, although when saving a report it will be visible only for the user that created it depending on the report's internal options.
Comments